COVID19 Challenge
A data challenge held by the @DataCommunitySA on March 15th, 2020 to submit a report that utilizes open sourced data of COVID19 and shows valuable extracted information regarding the virus
Among 150+ participants, I was palced the 3rd in a pool of 4 selected winners >> Congratulation tweet in Arabic
Main Report Content -- How Does It Fly?
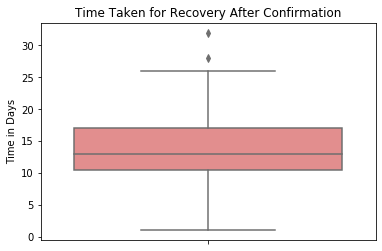
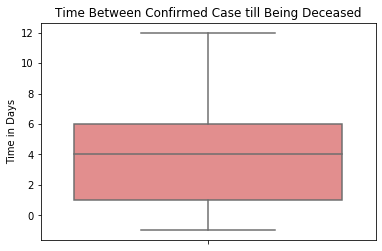
Time Cycle of the Virus
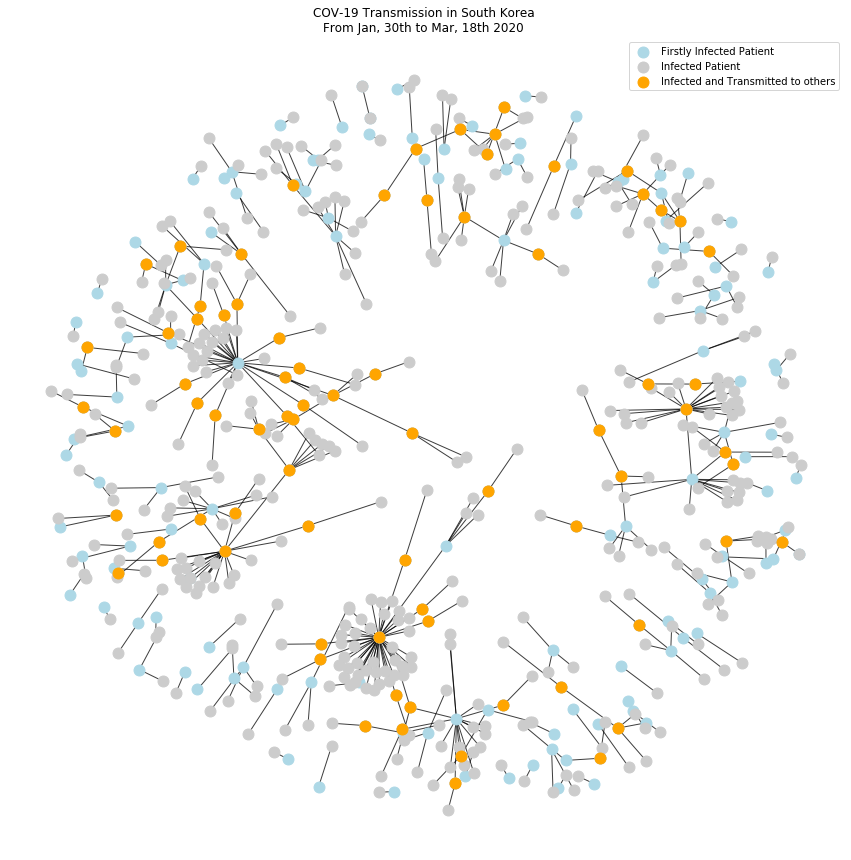
Contagiuosness Degree
- The minimum number of people infected by an COVID patient = 1
- The maximum number of people infected by an COVID patient = 44
- The average number = 2.27 and that almost similar to the reproductive number of the COVID19
Spread Factors
- It was assumed that some country-level factors e.g. life expectancy score, epidemics history (ebola, sars, mers-cov), etc. can show a correlation with the current COVID19 number of confirmed cases
- There was no strong correlation, but a potential correlation
- For example, life expectancy and population density showed an increasing pattern with the Log number of COVID19 confirmed cases


