3DPrinterCalibrationView
A simple way to visualize the calibration of your 3D Printer bed.
#Requirements
- Octave (https://www.gnu.org/software/octave/)
- A 3D Printer with AutoLevel enabled (Current version works only for Delta printers)
- The Z-Probe output data of your printer
#Example of usage In Mini Kossel the Z-Probe output data using Marlin firmware will be something like this:
             -0.070 -0.130 -0.130
      -0.300 -0.170 -0.150 -0.130 -0.220
-0.320 -0.230 -0.200 -0.210 -0.220 -0.260 -0.340
-0.270 -0.250 -0.220 -0.180 -0.160 -0.140 -0.210
-0.110 -0.140 -0.190 -0.240 -0.250 -0.220 -0.180
      -0.170 -0.190 -0.170 -0.070 -0.020
             -0.090 -0.210 -0.210
You will need to transform this data into an 7x7 matrix just like that:
        [0,0,-0.070 -0.130 -0.130,0,0;
     0,-0.300 -0.170 -0.150 -0.130 -0.220,0
-0.320 -0.230 -0.200 -0.210 -0.220 -0.260 -0.340;
-0.270 -0.250 -0.220 -0.180 -0.160 -0.140 -0.210;
-0.110 -0.140 -0.190 -0.240 -0.250 -0.220 -0.180;
     0,-0.170 -0.190 -0.170 -0.070 -0.020,0;
          0,0,-0.090 -0.210 -0.210,0,0]
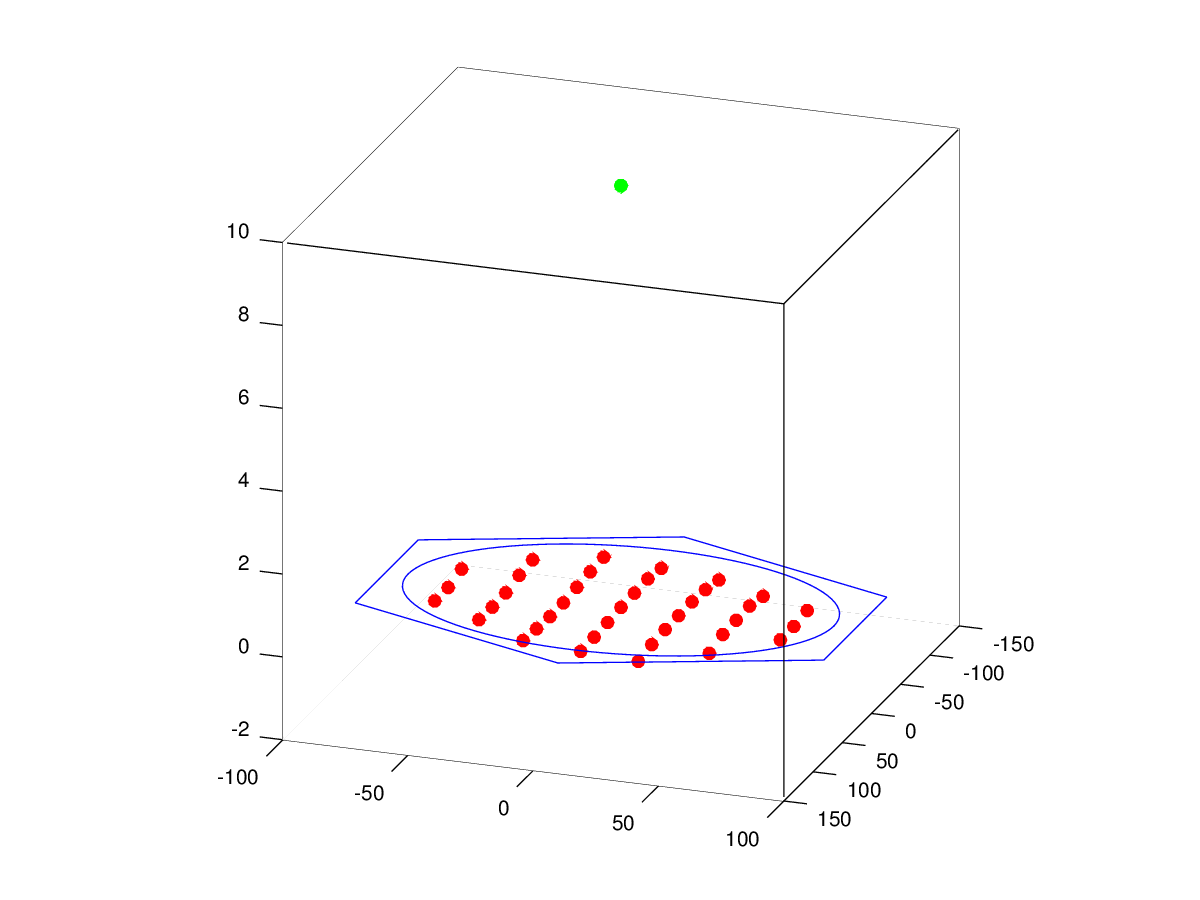
Just copy the functions to a folder and execute (using Octave) the following command "plotKosselBed(d,h,np,po,zp)":
plotKosselBed(170,true,true,[-21,-11.6],[0 0 -0.070 -0.130 -0.130 0 0; 0 -0.300 -0.170 -0.150 -0.130 -0.220 0; -0.320 -0.230 -0.200 -0.210 -0.220 -0.260 -0.340; -0.270 -0.250 -0.220 -0.180 -0.160 -0.140 -0.210; -0.110 -0.140 -0.190 -0.240 -0.250 -0.220 -0.180; 0 -0.170 -0.190 -0.170 -0.070 -0.020 0; 0 0 -0.090 -0.210 -0.210 0 0])
Where:
- d - diameter of your Delta Printer print area.
- h - If your bed is a hexagon. If True, a hexagon shaped bed will be plotted. False will plot just the circle area.
- np - Print the nozzle position relative to the AutoLevel Sensor
- po - the probe offset for x,y relative to the nozzle
- zp - The 7x7 matrix with the Z-Probe data.
