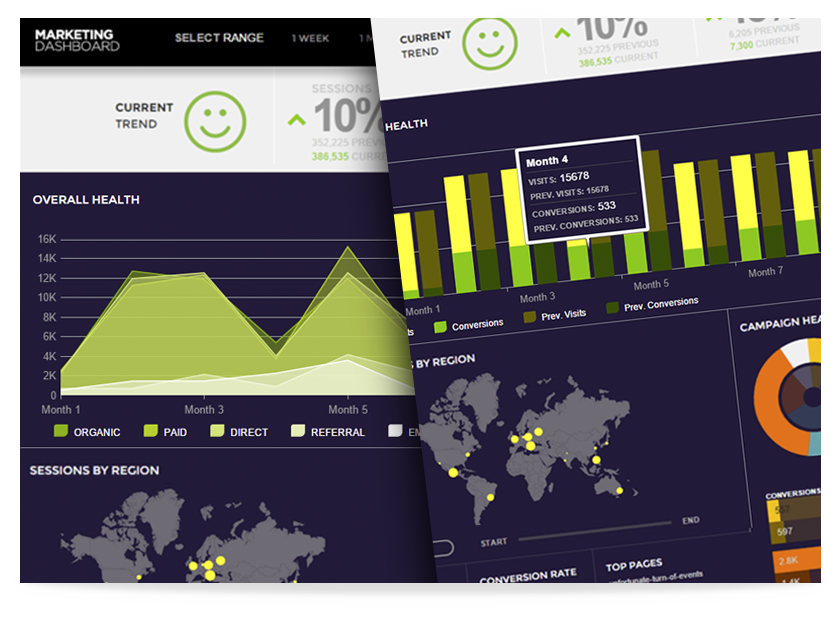
The Marketing Dashboard sample makes use of the Ignite UI date picker, data chart, map, doughnut chart and bullet graph controls to tackle specific analytical challenges. The dashboard view brings together different data points a marketing expert would want to track like sessions, conversions and conversion costs.
Ignite UI is an advanced HTML5+ toolset that helps you create stunning, modern Web apps. Building on jQuery and jQuery UI, it primarily consists of feature rich, high-performing UI controls/widgets such as all kinds of charts, data visualization maps, (hierarchical, editable) data grids, pivot grids, enhanced editors (combo box, masked editors, HTML editor, date picker, to name a few), flexible data source connectors, and a whole lot more. Too many to list here - check out the site for more info and to download a trial.
Ignite UI is not just another library created in someone's free time. It is commercial-ready, extremely well-tested, tuned for top performance, designed for good UX, and backed by Infragistics, an experience-focused company with a track record of over 24 years of experience in providing enterprise-ready, high-performance user interface tools for web, windows and mobile environments.


