This Analysis has two parts:
In this part of the analysis,
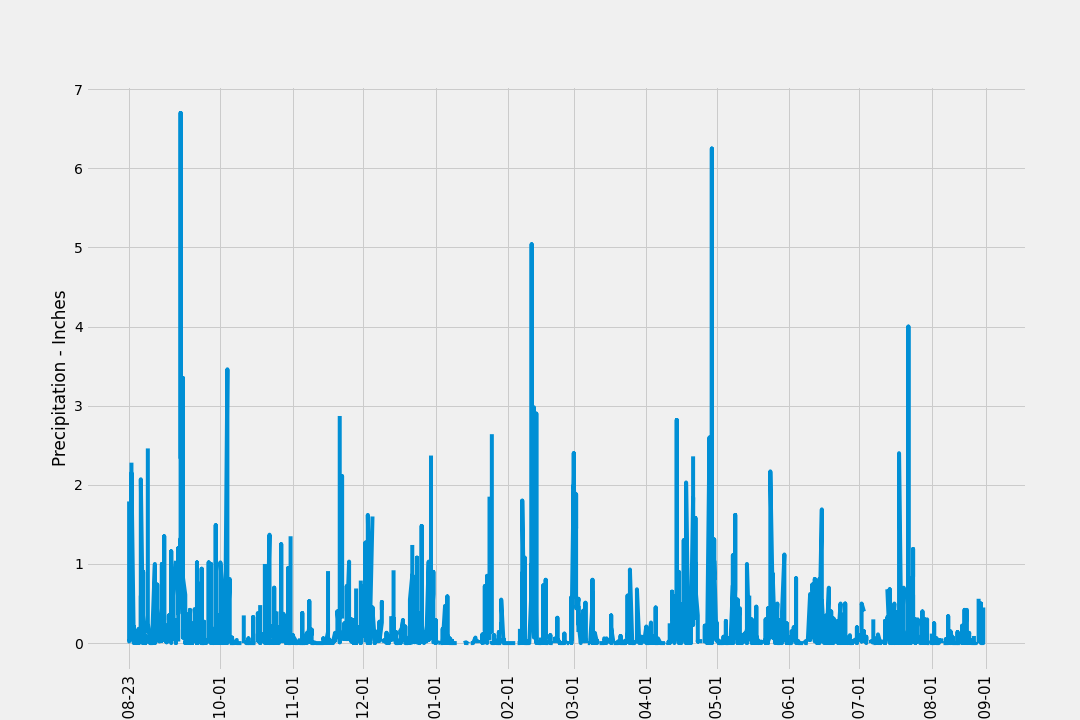
- The previous 12 months of precipitation data
-
The total number of stations in the dataset.
-
The most-active stations
-
The lowest, highest, and average temperatures of the most-active station id found in the previous query.
-
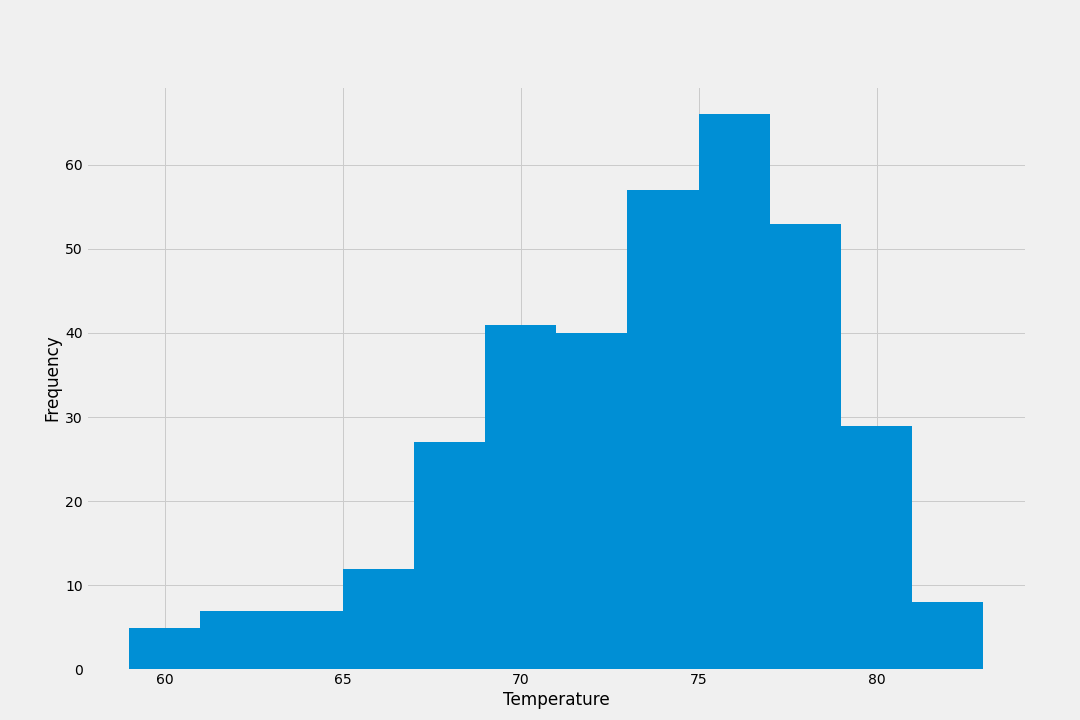
The previous 12 months of temperature observation (TOBS) data of the most active station
A Flask API based on the queries that has been just developed was created.

