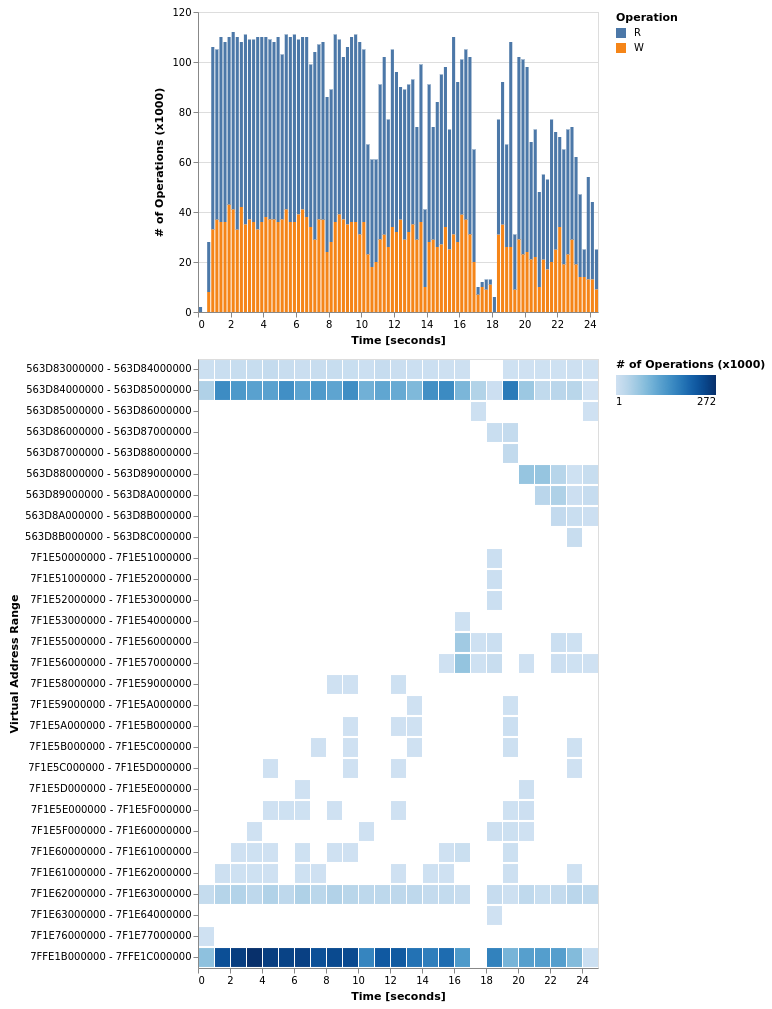
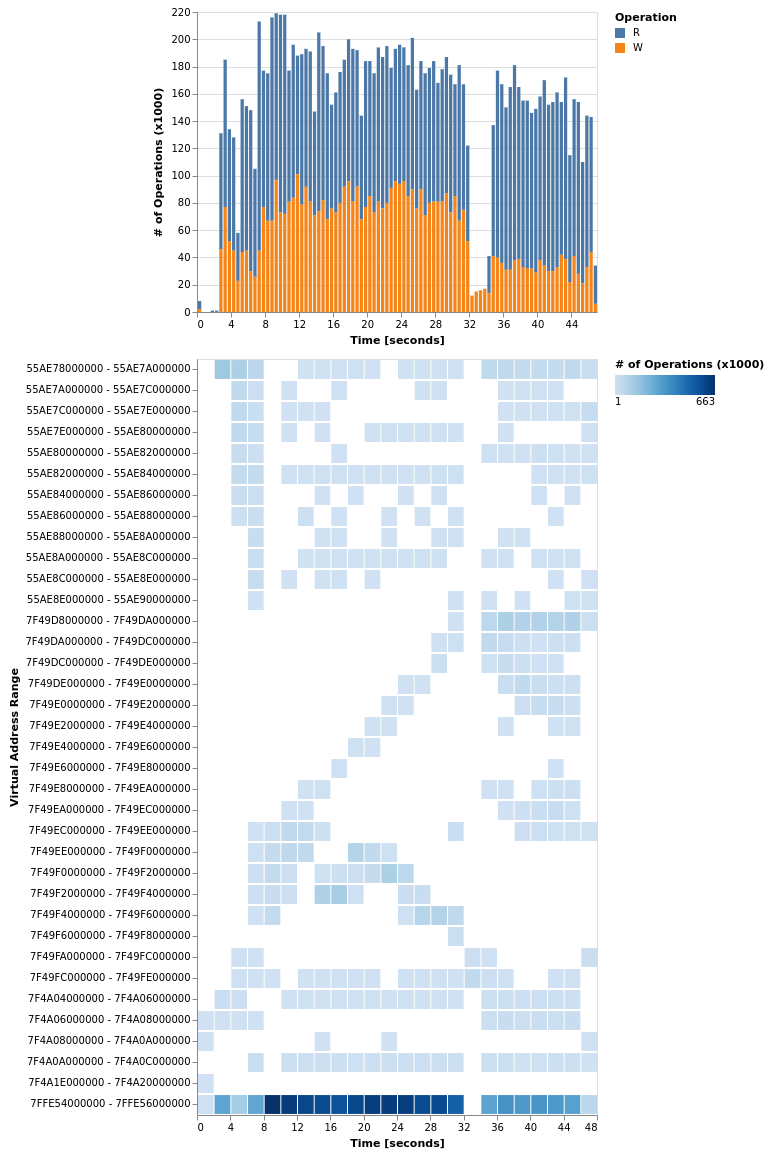
This is a small demo of MemStat, a Pintool I wrote to analyse the memory usage behaviour of executables. Pintool is the term for tools written for Intel Pin, a dynamic binary instrumentation tool.
MemStat - A Pintool to analyse the memory access behaviour of executables
Copyright (C) 2019 Immanuel Haffner
This program is free software: you can redistribute it and/or modify it under the terms of the GNU General Public License as published by the Free Software Foundation, either version 3 of the License, or (at your option) any later version.
This program is distributed in the hope that it will be useful, but WITHOUT ANY WARRANTY; without even the implied warranty of MERCHANTABILITY or FITNESS FOR A PARTICULAR PURPOSE. See the GNU General Public License for more details.
You should have received a copy of the GNU General Public License along with this program. If not, see http://www.gnu.org/licenses/.
Below I show two examples of the information gathered with MemStat. The first demo is a small DBMS project that our students have to implement in our core lecture "Database Systems". (Here I have used my reference implementation.) The second example is Intel Embree, a collection of high-performance ray tracing kernels. In particular, I used Embree's path tracer to render the Crown of Austria model.
Profile the DBMS indexing benchmark with MemStat:
$ ~/Documents/pin/pin \
    -t ~/Documents/pin/source/tools/MemStat/obj-intel64/MemStat.so -- \
        build_release/bin/benchmark_indices 1000000 \
            resource/lineitem_1kk.tbl resource/orders.tbl 3 43
Without instrumentation the application runs 2 seconds.
| NTH_SAMPLE | TIME [sec] | SIZE [MiB] |
|---|---|---|
| 100000 | 21.644 | |
| 10000 | 20.968 | |
| 5000 | 21.303 | |
| 1000 | 22.184 | |
| 500 | 23.179 | 70 |
| 400 | 26.031 | |
| 300 | 25.007 | |
| 200 | 26.504 | |
| 100 | 34.469 |
Profile the Intel Embree Path Tracer rendering the Crown of Austria model:
~/Documents/pin/pin -t ~/Documents/pin/source/tools/MemStat/obj-intel64/MemStat.so -- \
    build_release/pathtracer --threads 1 -c crown/crown.ecs -o crown/crown.jpg
Running time w/o instrumentation is 4.240 seconds; with instrumentation 42.576 seconds.
Included in this repository is a Jupyter Notebook where the gathered profiling data is visualized with Altair. The visualizations are interactive, you can select regions to zoom in to get more fine granular visualizations.
To run the demo you will need the profiling data, that is available on my Google Drive: dbms.bin and embree.bin
Currently the code of the MemStat Pintool is closed source, sorry. The licence applies to the code provided in this repository, i.e. the Jupyter Notebook.

