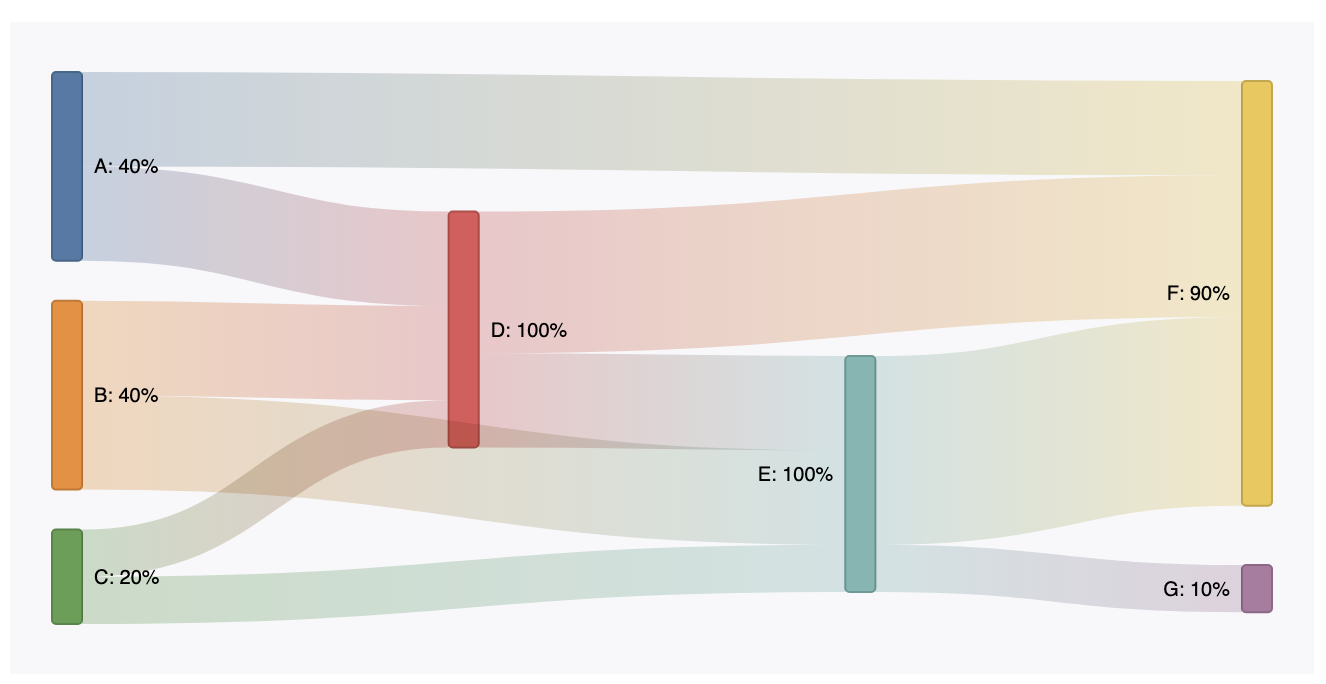
Sankey diagram implementation for directed flow visualization between nodes in an acyclic network.
Using the grafana-cli:
grafana-cli --pluginUrl https://github.com/IsmaelMasharo/sankey-panel/raw/master/sankey-panel.zip plugins install sankey-panelTested on Grafana 7.3.1
The diagram gets constructed from a data source formatted as table with 3 mandatory fields: source (text), target (text), value (numeric, no nulls). The diagram at the beginning was created with the following table format:
| source | target | value |
|---|---|---|
| A | D | 2 |
| B | D | 2 |
| B | E | 2 |
| A | F | 2 |
| D | E | 2 |
| D | F | 3 |
| E | F | 4 |
| C | D | 1 |
| C | E | 1 |
| E | G | 1 |
Being an acyclic implementation of the Sankey diagram loops are not allowed:
| source | target | value |
|---|---|---|
| A | B | 2 |
| B | A (x) | 2 |
To avoid circular link error a masked prefix could be set on the target values:
| source | target | value |
|---|---|---|
| A | B | 2 |
| B | P-A | 2 |
There are 5 options for displaying the diagram: Alignment, Color, Edge Color, Display Values, Highlight Connections
Arranges the nodes to one of the following sides: Left, Right, Center, Justify. See d3 sankey nodeAlign for image reference.
Nodes and links color. Based on d3 categorical schemes.
Represents the link's color transition from source to the target node.
- Input: Link takes the color of the source node.
- Output: Link takes the color of the target node.
- Input-Output: The link will be colored as a gradient from source to target node colors.
- None: Gray links.
Values are shown next to the node name.
- Total: Display link weight value.
- Percentage: Display link weight percentage value relative to the source.
- Both: Display both total and percentage.
- None: No values displayed (except for node name).
Boolean. Highlights links and nodes with a direct connection to the hovered node.
