Horizontal Pod Autoscaler (HPA) is a powerful and essential tool in the toolbox of Kubernetes (K8s), but configuring HPA is not straight-forward and easy due to fast iterating APIs and complicated components involved in.
I try to leverage the fascinating works of K8s communities with minimal customization to configure production-ready HPA. Hopefully this can be a starting point for anyone who is interested in this tooling.
In this repo, we will use RabbitMQ as custom metric inputs.
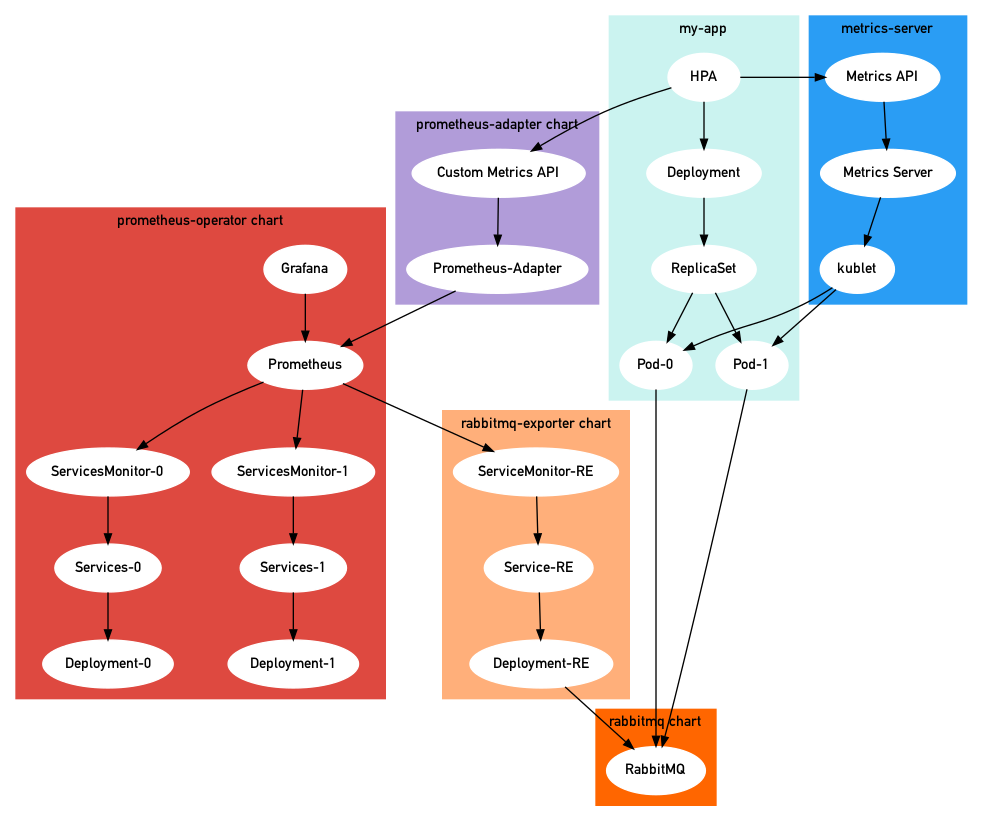
metrics-serverprovides thev1beta1.metrics.k8s.ioAPIprometheus-adapterchart provides thev1beta1.custom.metrics.k8s.ioAPIprometheus-operatorchart installs the system of Prometheusrabbitmqchart installs rabbitmq instancerabbitmq-exporterchart installs metrics scarper for rabbitmq
The Kubernetes Metrics Server is an aggregator of resource usage data in the cluster, which is pre-installed in latest AKS and GKE but not for EKS.
kubectl apply -f https://github.com/kubernetes-sigs/metrics-server/releases/download/v0.3.6/components.yamlVerifying the installation:
kubectl get apiservices v1beta1.metrics.k8s.ioNAME SERVICE AVAILABLE AGE
v1beta1.metrics.k8s.io kube-system/metrics-server True 2d2hView nodes metrics:
kubectl get --raw "/apis/metrics.k8s.io/v1beta1/nodes" | jq .{
"kind": "NodeMetricsList",
"apiVersion": "metrics.k8s.io/v1beta1",
"metadata": {
"selfLink": "/apis/metrics.k8s.io/v1beta1/nodes"
},
"items": [
{
"metadata": {
"name": "ip-192-168-28-146.ec2.internal",
"selfLink": "/apis/metrics.k8s.io/v1beta1/nodes/ip-192-168-28-146.ec2.internal",
"creationTimestamp": "2020-05-14T18:53:23Z"
},
"timestamp": "2020-05-14T18:52:45Z",
"window": "30s",
"usage": {
"cpu": "1257860336n",
"memory": "1659908Ki"
}
},
]
}# hpa-v1.yml
---
apiVersion: autoscaling/v2beta2
kind: HorizontalPodAutoscaler
metadata:
name: demo-service
namespace: demo
spec:
scaleTargetRef:
apiVersion: apps/v1
kind: Deployment
name: demo-service
minReplicas: 1
maxReplicas: 4
metrics:
- type: Resource
resource:
name: cpu
target:
type: Utilization
averageUtilization: 50Create monitoring namespace:
kubectl create namespace monitoringInstalling prometheus-operator:
helm install monitoring stable/prometheus-operator --set prometheus.prometheusSpec.serviceMonitorSelectorNilUsesHelmValues=false --namespace monitoringIn order to discover ServiceMonitors outside monitoring namespace, we need to set prometheus.prometheusSpec.serviceMonitorSelectorNilUsesHelmValues to false based on this doc.
We can go to Prometheus by visiting localhost:9090 after port-forwarding the service to our localhost:
kubectl -n monitoring port-forward svc/monitoring-prometheus-oper-prometheus 9090We can check Grafana dashboard on localhost:8080 by port-forwarding as well.
kubectl -n monitoring port-forward svc/monitoring-grafana 8080:80the default credentials for Grafana:
username: admin
password: prom-operator
We will install rabbitmq related stuff under demo namespace
kubectl create namespace demohelm install my-rabbitmq stable/rabbitmq --set rabbitmq.username=admin,rabbitmq.password=secretpassword,rabbitmq.erlangCookie=secretcookie -n demothe credentials we created:
Username: admin
Password: secretpassword
We use this credentials in the prometheus-rabbitmq-exporter/values.yaml.
Install prometheus-rabbitmq-exporter
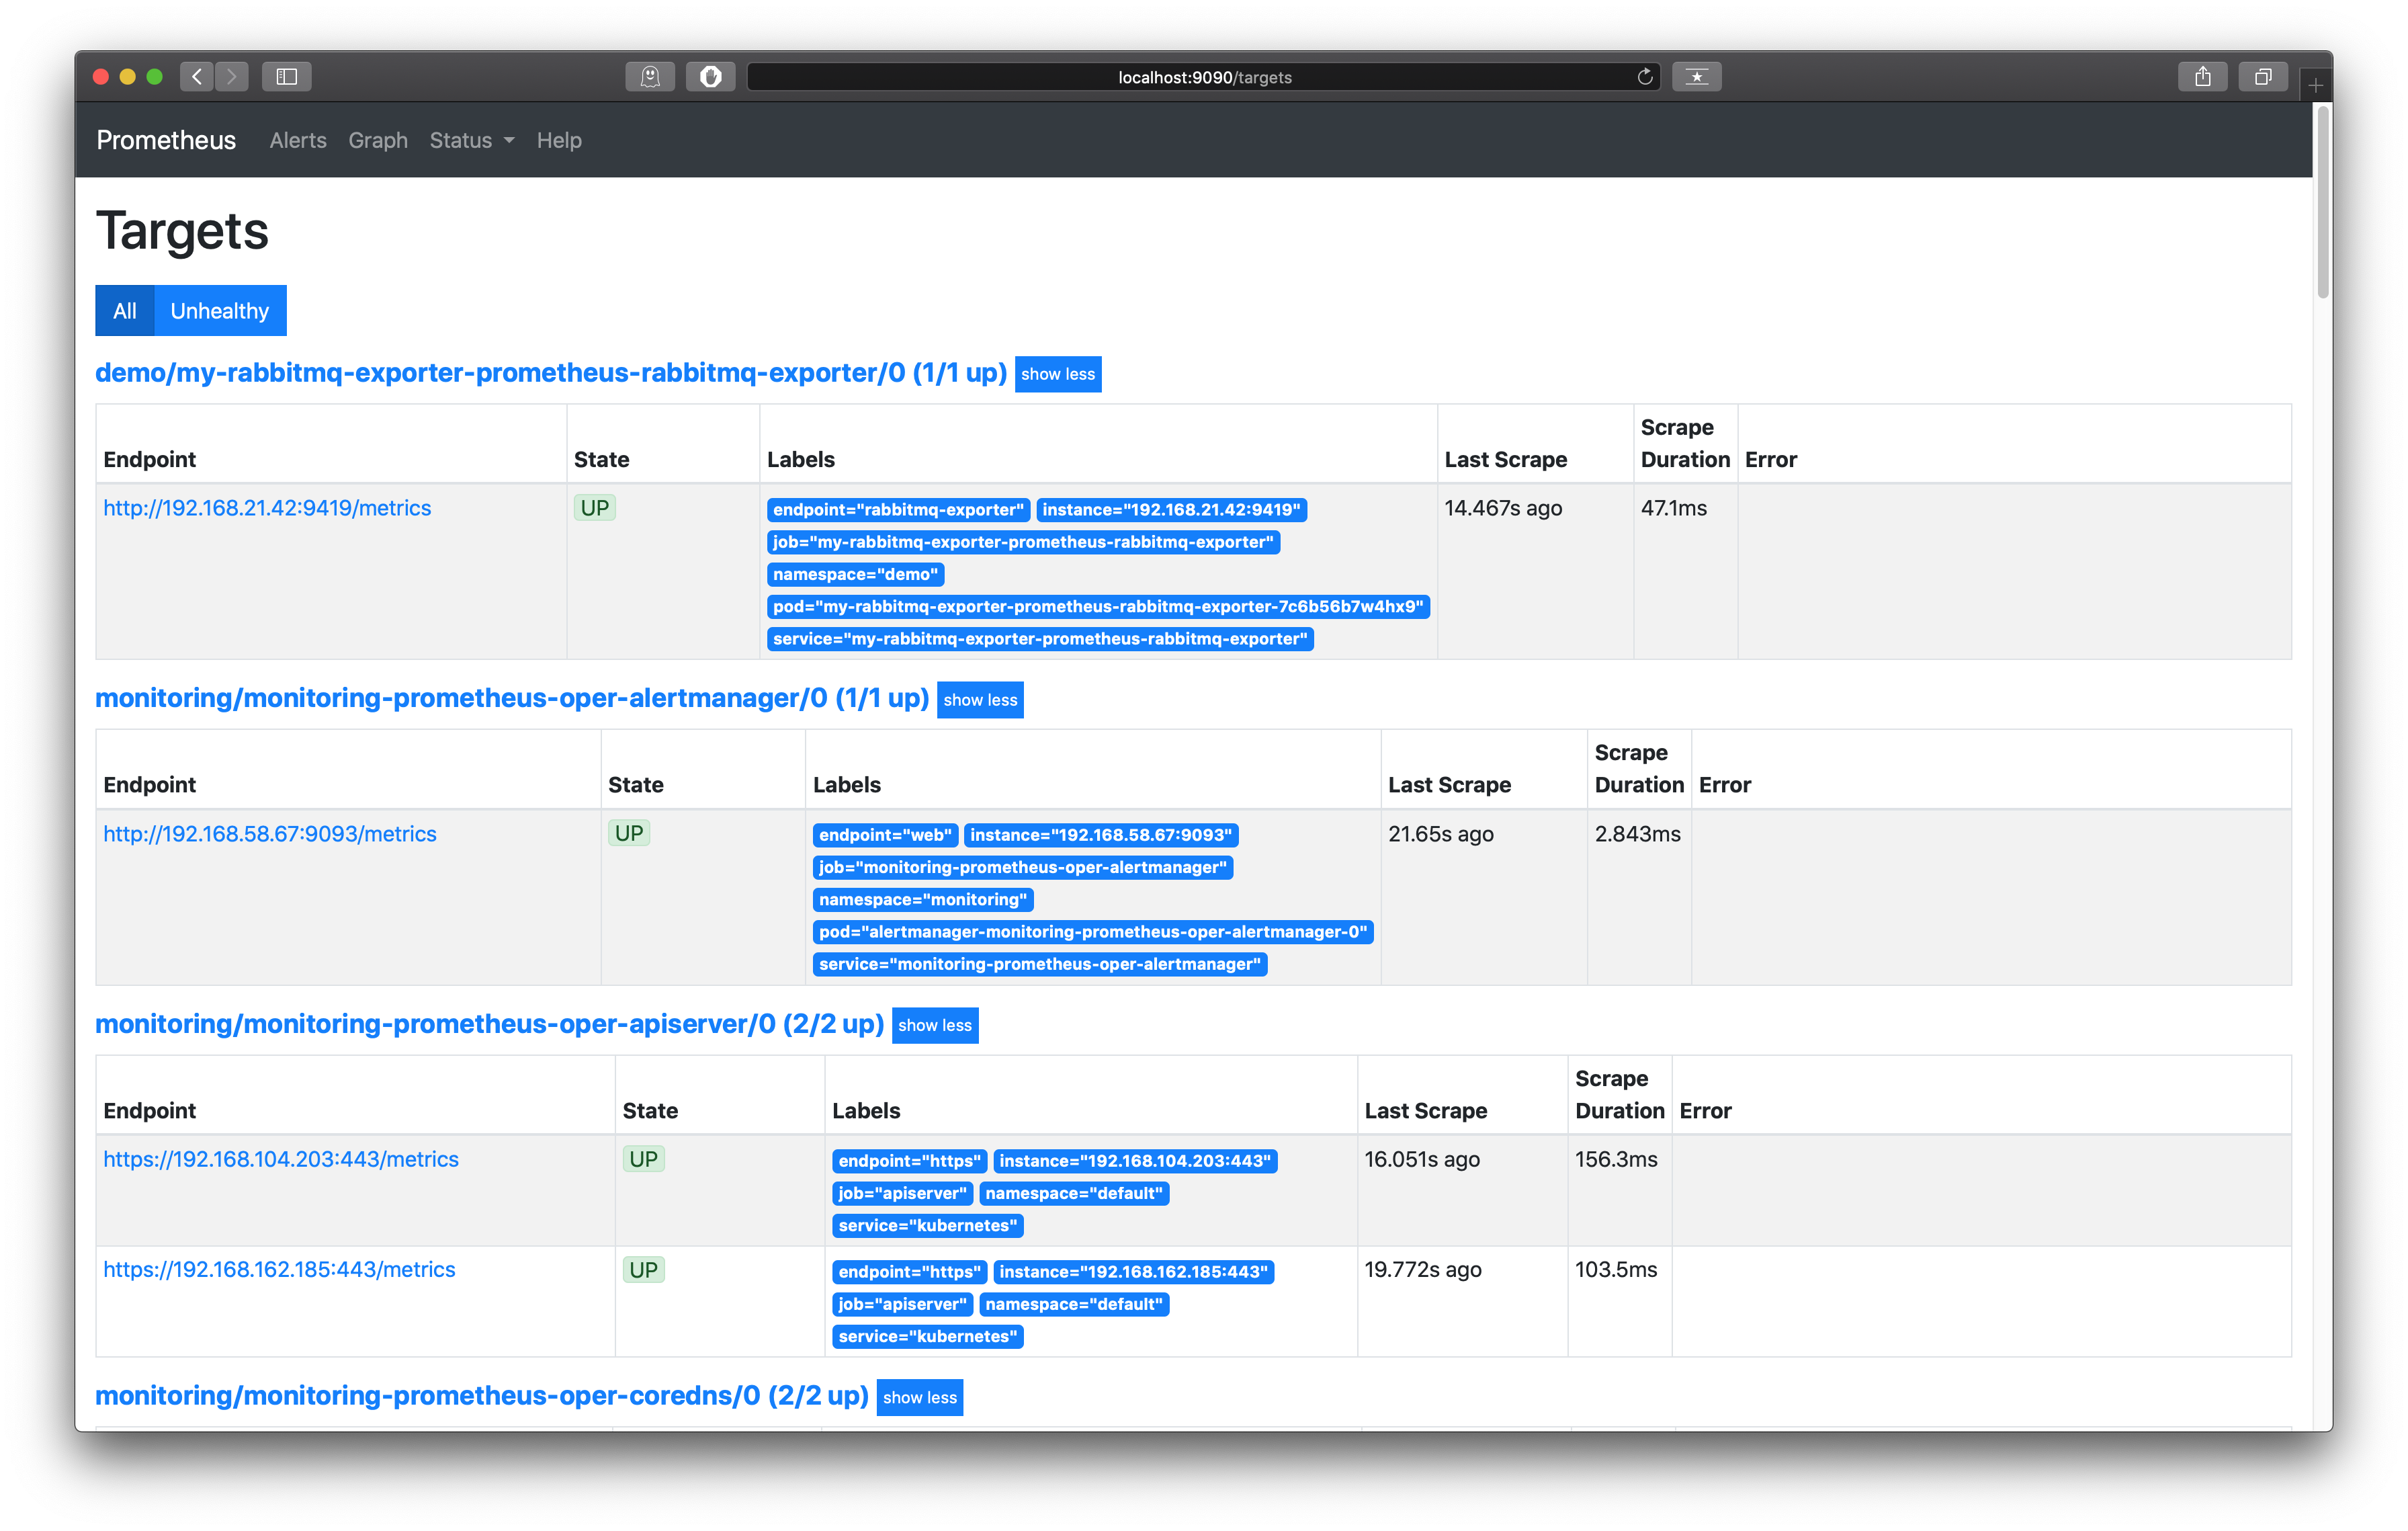
helm install my-rabbitmq-exporter stable/prometheus-rabbitmq-exporter -n demo -f prometheus-rabbitmq-exporter/values.yamlAfter deploying done, we should be able to see the targets in the Prometheus on localhost:9090/targets
Installing prometheus-adapter:
helm install custom-metrics-api -n monitoring stable/prometheus-adapter -f prometheus-adapter/values.yamlWe need to specify the prometheus url based on our above chart installation and setting up the custom rules. You can find the details in the prometheus-adapter/values.yaml.
The yalm file was built upon configuration example. And I highly recommend going through it to have a better understanding of the configuration.
Verifying the installation:
kubectl get apiservices v1beta1.custom.metrics.k8s.ioNAME SERVICE AVAILABLE
v1beta1.custom.metrics.k8s.io monitoring/custom-metrics-api-prometheus-adapter True Now we can use the custom metrics API to get the information of the my-rabbitmq instance
kubectl get --raw /apis/custom.metrics.k8s.io/v1beta1 | jq .{
"kind": "APIResourceList",
"apiVersion": "v1",
"groupVersion": "custom.metrics.k8s.io/v1beta1",
"resources": [
{
"name": "namespaces/rabbitmq_queue_messages_ready",
"singularName": "",
"namespaced": false,
"kind": "MetricValueList",
"verbs": [
"get"
]
},
{
"name": "services/rabbitmq_queue_messages_ready",
"singularName": "",
"namespaced": true,
"kind": "MetricValueList",
"verbs": [
"get"
]
}
]
}And we can get the rabbitmq_queue_messages_ready metric for a specific queue by using metricLabelSelector query in the api. (You need to make sure test queue exists in the RabbitMQ before running below command)
kubectl get --raw "/apis/custom.metrics.k8s.io/v1beta1/namespaces/demo/services/my-rabbitmq-exporter-prometheus-rabbitmq-exporter/rabbitmq_queue_messages_ready?metricLabelSelector=queue%3Dtest" | jq .{
"kind": "MetricValueList",
"apiVersion": "custom.metrics.k8s.io/v1beta1",
"metadata": {
"selfLink": "/apis/custom.metrics.k8s.io/v1beta1/namespaces/demo/services/my-rabbitmq-exporter-prometheus-rabbitmq-exporter/rabbitmq_queue_messages_ready"
},
"items": [
{
"describedObject": {
"kind": "Service",
"namespace": "demo",
"name": "my-rabbitmq-exporter-prometheus-rabbitmq-exporter",
"apiVersion": "/v1"
},
"metricName": "rabbitmq_queue_messages_ready",
"timestamp": "2020-05-15T15:19:57Z",
"value": "3",
"selector": null
}
]
}# hpa-v2.yml
---
apiVersion: autoscaling/v2beta2
kind: HorizontalPodAutoscaler
metadata:
name: demo-service
namespace: demo
spec:
scaleTargetRef:
apiVersion: apps/v1
kind: Deployment
name: demo-service
minReplicas: 1
maxReplicas: 4
metrics:
- type: Object
object:
metric:
name: rabbitmq_queue_messages_ready
selector:
matchLabels:
queue: test
describedObject:
apiVersion: v1
kind: Service
name: my-rabbitmq-exporter-prometheus-rabbitmq-exporter
target:
type: Value
value: "1"Uninstall charts and delete namespaces
helm delete -n demo my-rabbitmq-exporter
helm delete -n demo my-rabbitmq
helm delete -n monitoring monitoring
kubectl delete namespace demo
kubectl delete namespace monitoring
