BioEnricher lies in addressing two issues: firstly, it facilitates the seamless integration for enrichment analysis, encompassing diverse functionalities such as GO, KEGG, WikiPathways, Reactome, MsigDB, Disease Ontology, Cancer Gene Network, DisGeNET, CellMarker, and CMAP (drugs); infers the activities of transcription factors and PROGENy cancer pathways; searches the gene information, PubMed records and GEO metadata based on the input terms; secondly, it encapsulates advanced visualization functions, streamlining the process for faster and more convenient data presentation.
You can install the released version of BioEnricher from Github with:
packages <- c("broom", "clusterProfiler", "dorothea", "DOSE", "dplyr", "enrichplot",
              "europepmc", "ggplot2", "GSVA", "HGNChelper", "Hmisc", "httr", "jsonlite",
              "magrittr", "msigdbr", "openssl", "pathview", "png", "progeny", "purrr",
              "ReactomePA", "rlang", "stats", "stringr", "viper", "vroom")

# Check and install the missing CRAN packages
install_if_missing <- function(package) {
  if (!require(package, character.only = TRUE)) {
    install.packages(package)
  }
}

# Check and install the missing Bioconductor packages
install_bioc_if_missing <- function(package) {
  if (!require(package, character.only = TRUE)) {
    BiocManager::install(package)
  }
}

for (package in packages) {
  if (package %in% c("clusterProfiler", "DOSE", "enrichplot", "ReactomePA", "GSVA", "msigdbr")) {
    install_bioc_if_missing(package)
  } else {
    install_if_missing(package)
  }
}

install.packages('BioEnricher_0.1.0.zip',repos=NULL,type='source')You should identify an interested gene list or an order-ranked geneList by employing differential analysis or other methods.
library(airway)
library(DESeq2)
library(tidyverse)
library(clusterProfiler)
library(org.Hs.eg.db)
data(airway)
se <- airway
se$dex <- relevel(se$dex, "untrt")
res <- DESeqDataSet(se, design = ~ cell + dex)%>%
  estimateSizeFactors()%>%DESeq()%>%
  results()%>%as.data.frame()%>%na.omit()
ann <- bitr(rownames(res),'ENSEMBL','SYMBOL',org.Hs.eg.db)
res <- merge(ann,res,by.x=1,by.y=0)%>%distinct(SYMBOL,.keep_all = T) # Very crude, just as an example
# Define an up-regulated gene list
up.genes <- res$SYMBOL[res$log2FoldChange > 2 & res$padj < 0.05]
# Define a down-regulated gene list
down.genes <- res$SYMBOL[res$log2FoldChange < -2 & res$padj < 0.05]You can get a list of enrichment methods BioEnricher can perform:
listEnrichMethod()
# "GO", "KEGG", "MKEGG", "WikiPathways", "Reactome", "MsigDB", "DO", "CGN", "DisGeNET", "CellMarker", "CMAP"This function will perform over-representative analysis including GO, KEGG, WikiPathways, Reactome, MsigDB, Disease Ontoloty, Cancer Gene Network, DisGeNET, CellMarker, and CMAP.
# Set enrich.type using an enrichment analysis method mentioned above.
kegg <- lzq_ORA(
  genes = res$SYMBOL[res$log2FoldChange > 0 & res$padj < 0.05],
  enrich.type = 'KEGG'
)

# This function will output its calculation process.
+++ Updating gene symbols...
Maps last updated on: Thu Oct 24 12:31:05 2019
+++ Transforming SYMBOL to ENTREZID...
'select()' returned 1:1 mapping between keys and columns
+++ Performing KEGG enrichment...
+++ 109 significant terms were detected...
+++ Done!res2 <- res[res$log2FoldChange > 0 & res$padj < 0.05,c(2,4)]
res2 <- data.frame(row.names = res2$SYMBOL,R=res2$log2FoldChange)
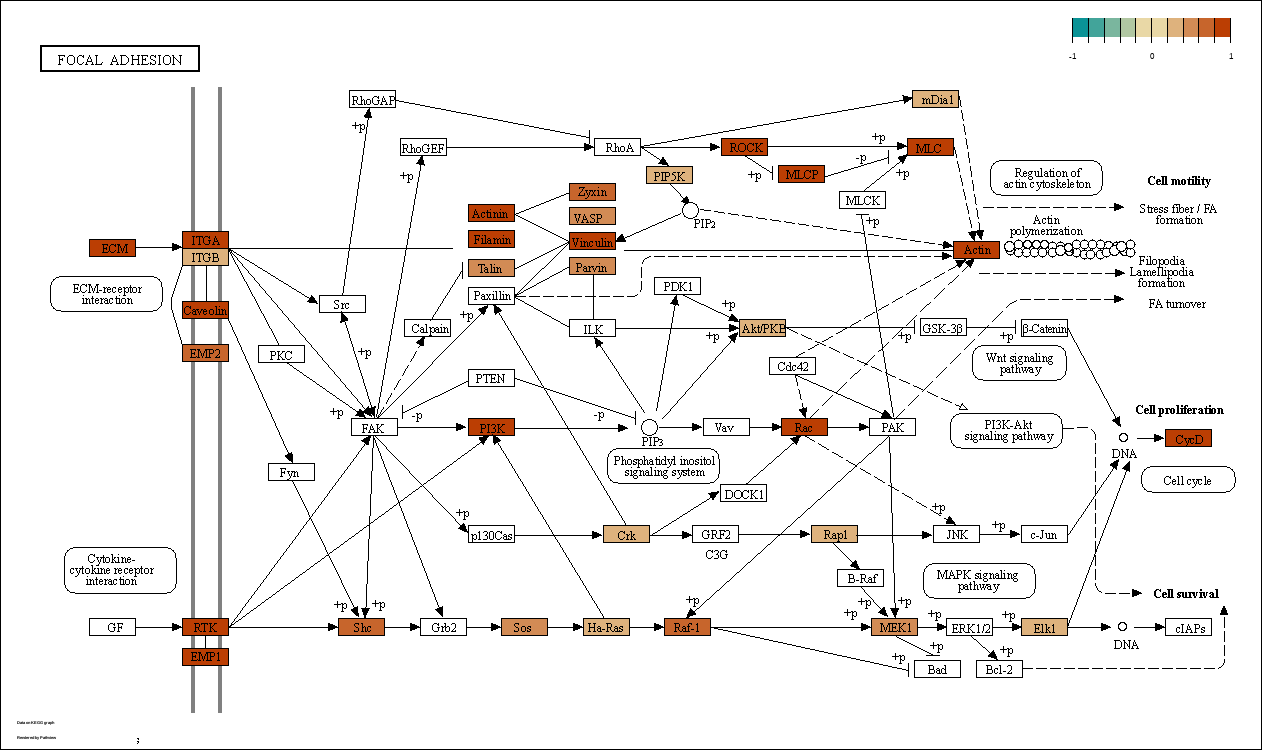
lzq_KEGGview(gene.data = res2,pathway.id = 'hsa04218')This function will perform an integration for ORA enrichment analysis, including GO, KEGG, WikiPathways, Reactome, MsigDB, Disease Ontology, Cancer Gene Network, DisGeNET, CellMarker, and CMAP (drugs).
library(BioEnricher)
# Integrative enrichment analysis of the up-regulated gene list
up.enrich <- lzq_ORA.integrated(
  genes = up.genes,
  background.genes = NULL,
  GO.ont = 'ALL',
  perform.WikiPathways = T,
  perform.Reactome = T,
  perform.MsigDB = T,
  MsigDB.category = 'ALL',
  perform.Cancer.Gene.Network = T,
  perform.disease.ontoloty = T,
  perform.DisGeNET = T,
  perform.CellMarker = T,
  perform.CMAP = T,
  min.Geneset.Size = 3
)

# This function will output its calculation process.
+++ Updating gene symbols...
Maps last updated on: Thu Oct 24 12:31:05 2019
+++ Transforming SYMBOL to ENTREZID...
'select()' returned 1:1 mapping between keys and columns
+++ Performing GO-ALL enrichment...
+++ Symplifying GO results...
+++ Performing KEGG enrichment...
+++ Performing Module KEGG enrichment...
+++ Performing WikiPathways enrichment...
+++ Performing Reactome pathways enrichment...
+++ Performing Disease Ontoloty enrichment...
+++ Performing Cancer Gene Network enrichment...
+++ Performing DisGeNET enrichment...
+++ Performing CellMarker enrichment...
+++ Performing MsigDB-ALL enrichment...
+++ Performing CMAP enrichment...
+++ 1765 significant terms were detected...
+++ Done!
# Integrative enrichment analysis of the down-regulated gene list
down.enrich <- lzq_ORA.integrated(
genes = down.genes,
background.genes = NULL,
GO.ont = 'ALL',
perform.WikiPathways = T,
perform.Reactome = T,
perform.MsigDB = T,
MsigDB.category = 'ALL',
perform.Cancer.Gene.Network = T,
perform.disease.ontoloty = T,
perform.DisGeNET = T,
perform.CellMarker = T,
perform.CMAP = T,
min.Geneset.Size = 3
)
# This function will output its calculation process.
+++ Updating gene symbols...
Maps last updated on: Thu Oct 24 12:31:05 2019
+++ Transforming SYMBOL to ENTREZID...
'select()' returned 1:1 mapping between keys and columns
+++ Performing GO-ALL enrichment...
+++ Symplifying GO results...
+++ Performing KEGG enrichment...
+++ Performing Module KEGG enrichment...
+++ Performing WikiPathways enrichment...
+++ Performing Reactome pathways enrichment...
+++ Performing Disease Ontoloty enrichment...
+++ Performing Cancer Gene Network enrichment...
+++ Performing DisGeNET enrichment...
+++ Performing CellMarker enrichment...
+++ Performing MsigDB-ALL enrichment...
+++ Performing CMAP enrichment...
+++ 1426 significant terms were detected...
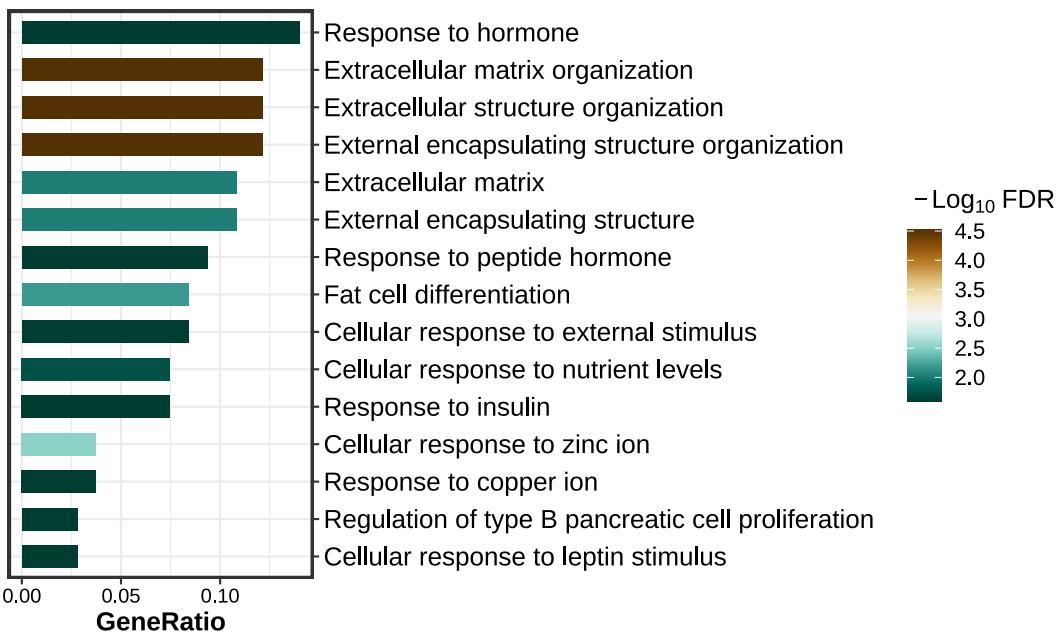
+++ Done!barplot
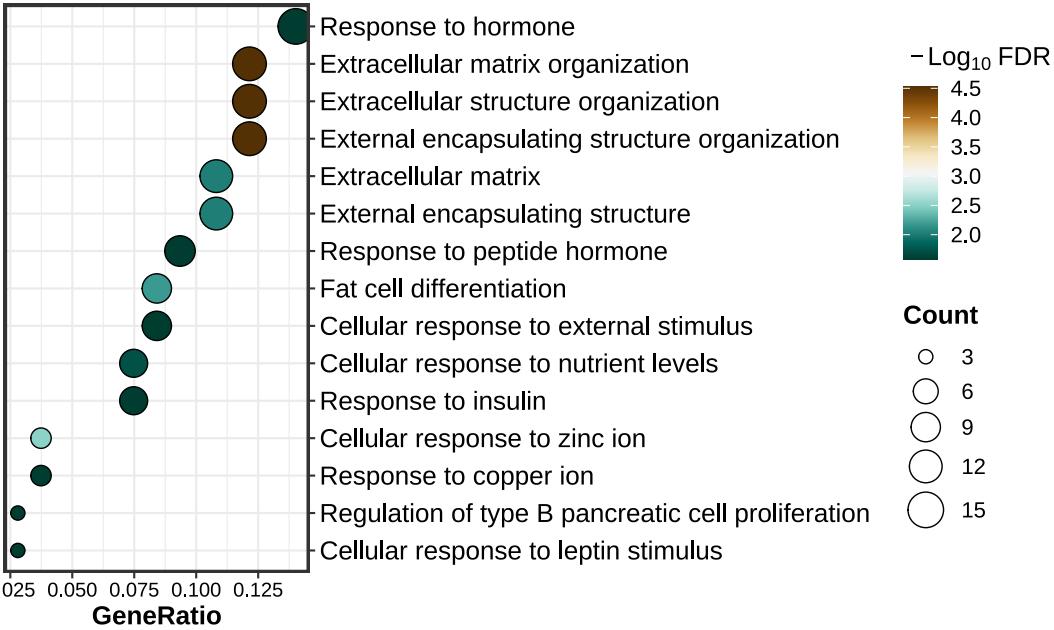
lzq_ORA.barplot1(enrich.obj = up.enrich$simplyGO)dotplot
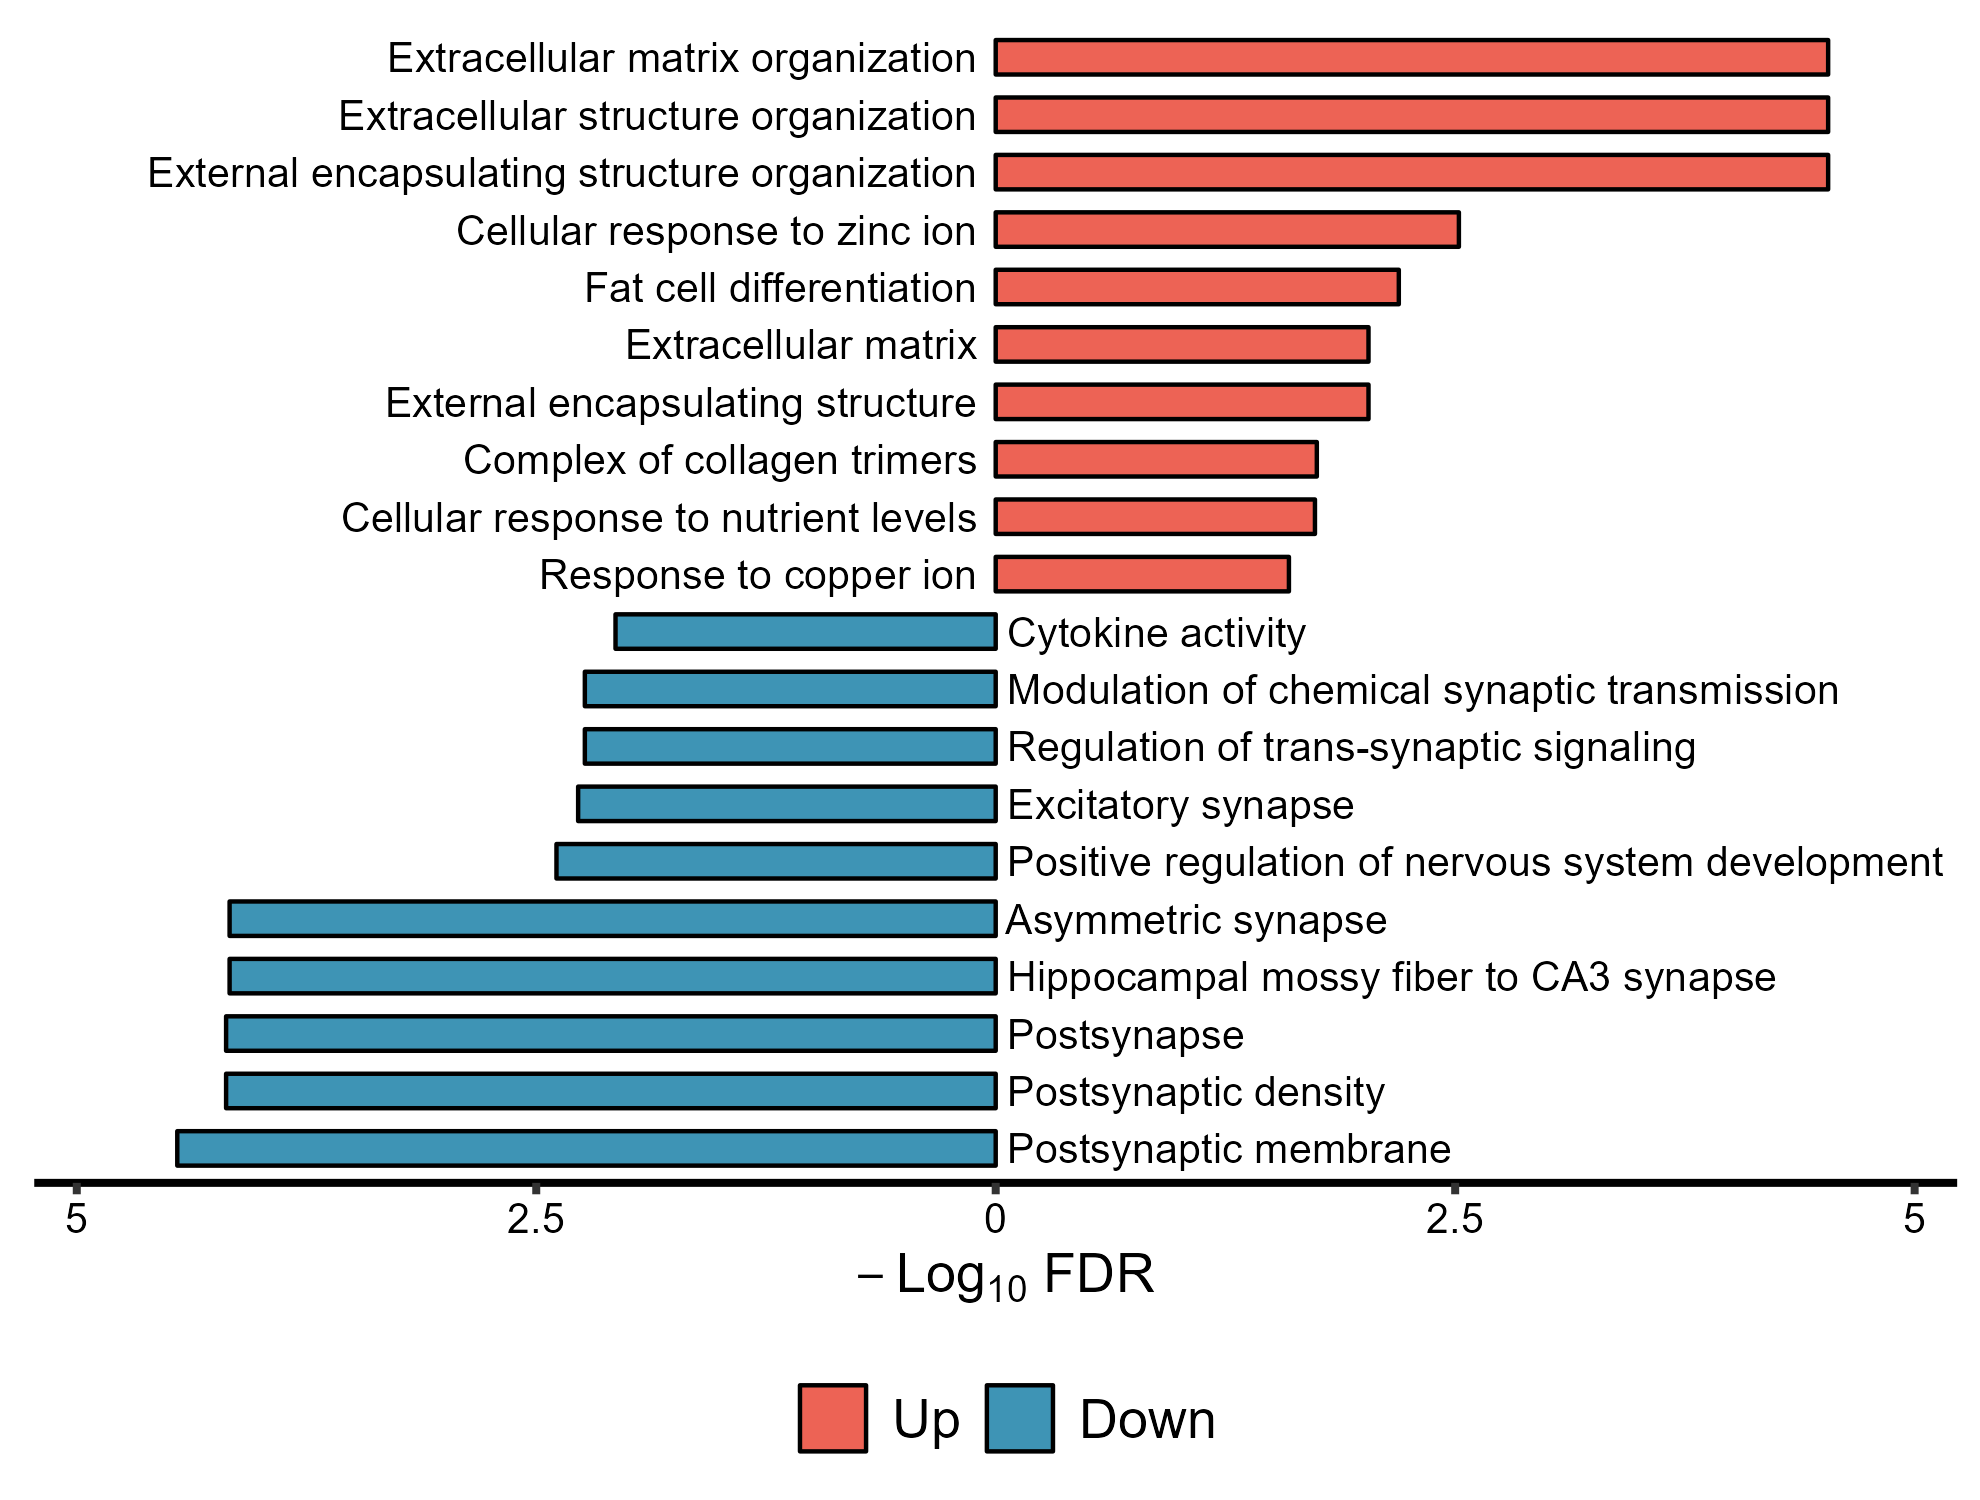
lzq_ORA.dotplot1(enrich.obj = up.enrich$simplyGO)lzq_ORA.barplot2(
enrich.obj1 = up.enrich$simplyGO,
enrich.obj2 = down.enrich$simplyGO,
obj.types = c('Up','Down')
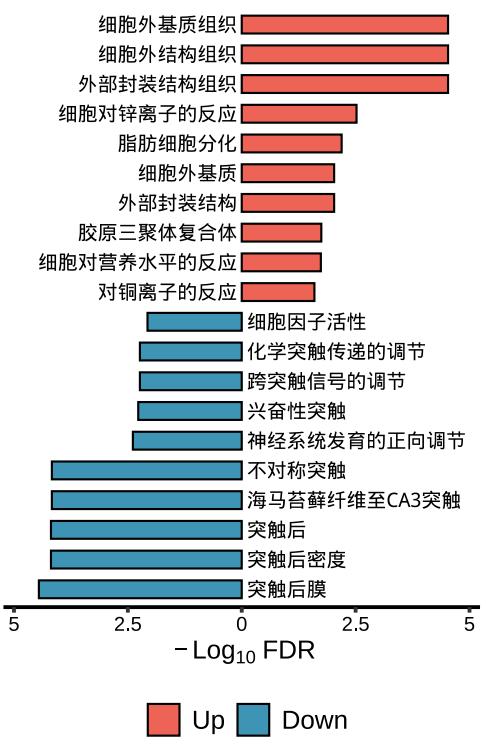
)lzq_ORA.barplot2(
enrich.obj1 = up.enrich$simplyGO,
enrich.obj2 = down.enrich$simplyGO,
obj.types = c('Up','Down'),
use.Chinese = T
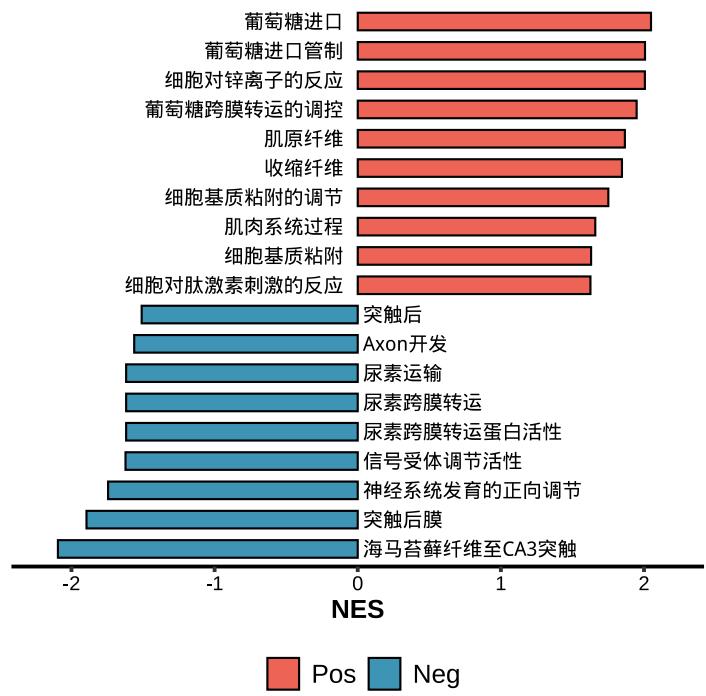
)Note: use.Chinese exists all the plot functions.
This function will perform gene-set enrichment analysis including GO, KEGG, WikiPathways, Reactome, MsigDB, Disease Ontoloty, Cancer Gene Network, DisGeNET, CellMarker, and CMAP.
# Obtain an order ranked geneList.
grlist <- res$log2FoldChange; names(grlist) <- res$SYMBOL
grlist <- sort(grlist,decreasing = T)

# Set enrich.type using an enrichment analysis method mentioned above.
fit <- lzq_GSEA(grlist,enrich.type = 'KEGG')

# This function will output its calculation process.
+++ Updating gene symbols...
Maps last updated on: Thu Oct 24 12:31:05 2019
+++ Transforming SYMBOL to ENTREZID...
'select()' returned 1:many mapping between keys and columns
+++ Performing KEGG enrichment...
+++ 8 significant terms were detected...
+++ Done!This function will perform an integration for GSEA enrichment analysis, including GO, KEGG, WikiPathways, Reactome, MsigDB, Disease Ontology, Cancer Gene Network, DisGeNET, CellMarker, and CMAP (drugs).
# Integrative enrichment analysis of the ranked gene list
fit2 <- lzq_GSEA.integrated(
  genes = grlist,
  gene.type = 'SYMBOL',
  GO.ont = 'ALL',
  perform.WikiPathways = T,
  perform.Reactome = T,
  perform.MsigDB = T,
  MsigDB.category = 'ALL',
  perform.Cancer.Gene.Network = T,
  perform.disease.ontoloty = T,
  perform.DisGeNET = T,
  perform.CellMarker = T,
  perform.CMAP = T,
  min.Geneset.Size = 3
)

# This function will output its calculation process.
+++ Updating gene symbols...
Maps last updated on: Thu Oct 24 12:31:05 2019
+++ Transforming SYMBOL to ENTREZID...
'select()' returned 1:many mapping between keys and columns
+++ Performing GO-ALL enrichment...
+++ Symplifying GO results...
+++ Performing KEGG enrichment...
+++ Performing Module KEGG enrichment...
+++ Performing WikiPathways enrichment...
+++ Performing Reactome pathways enrichment...
+++ Performing Disease Ontoloty enrichment...
+++ Performing Cancer Gene Network enrichment...
no term enriched under specific pvalueCutoff...
+++ Performing DisGeNET enrichment...
+++ Performing CellMarker enrichment...
+++ Performing MsigDB-ALL enrichment...
+++ Performing CMAP enrichment...
no term enriched under specific pvalueCutoff...
+++ 311 significant terms were detected...
+++ Done!Visualize analyzing result of GSEA
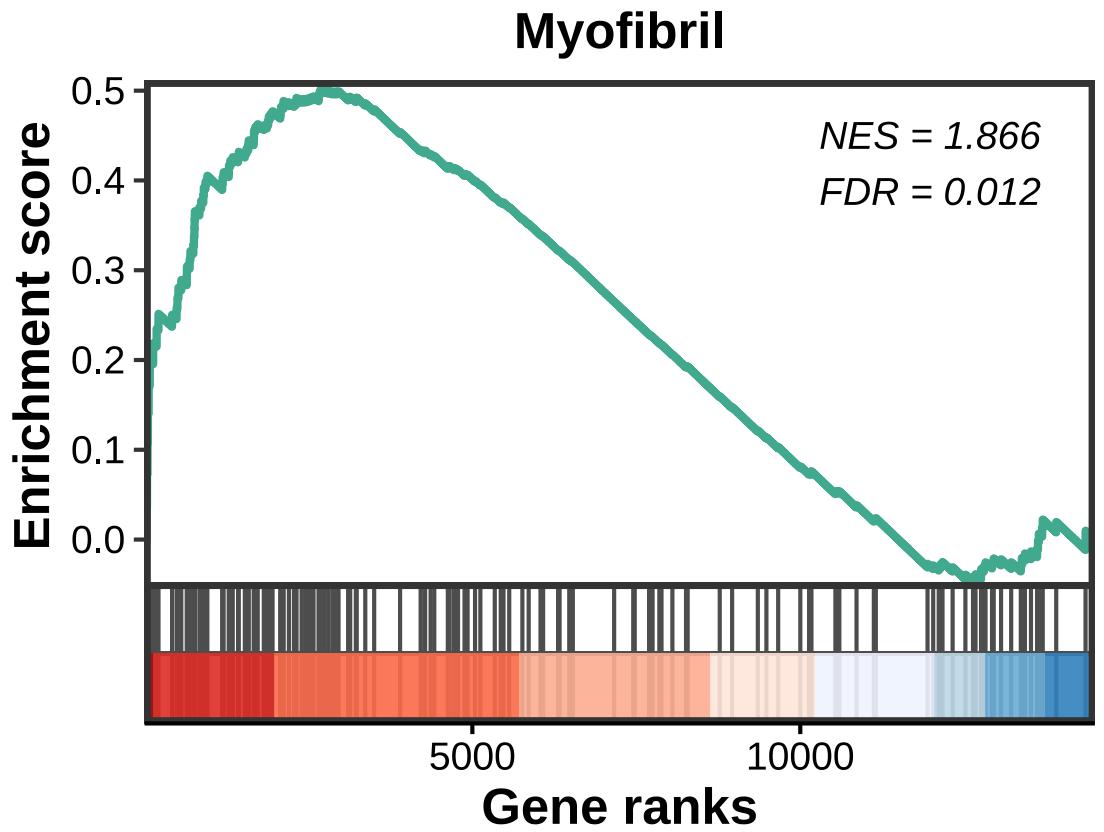
lzq_gseaplot(
  fit2$simplyGO,
  Pathway.ID = 'GO:0030016',
  rank = F,
  statistic.position = c(0.71,0.85),
  rel.heights = c(1, 0.4)
)
Enrichment barplot for positive or negative GSEA results
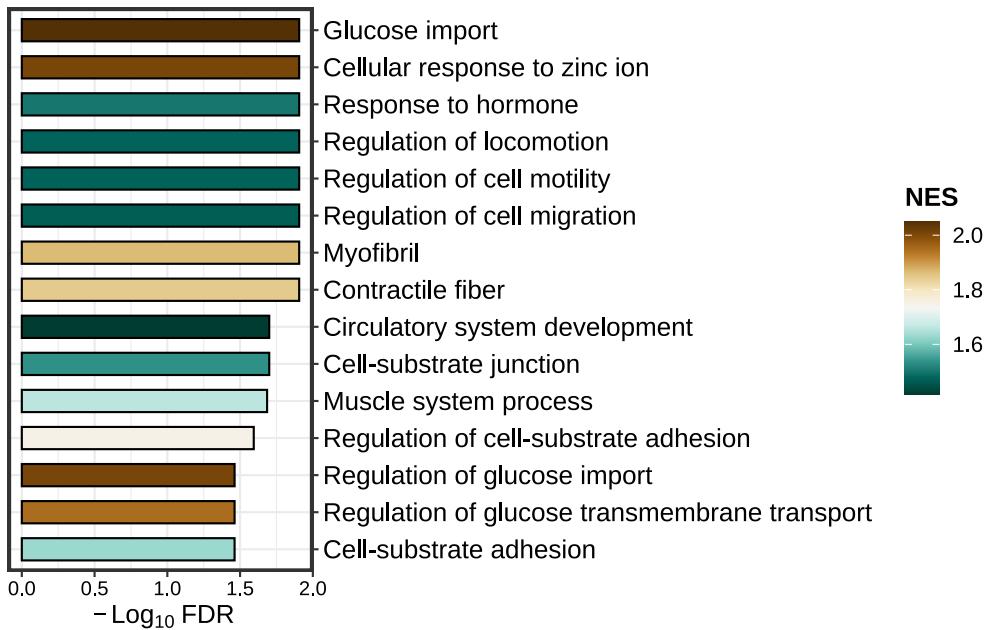
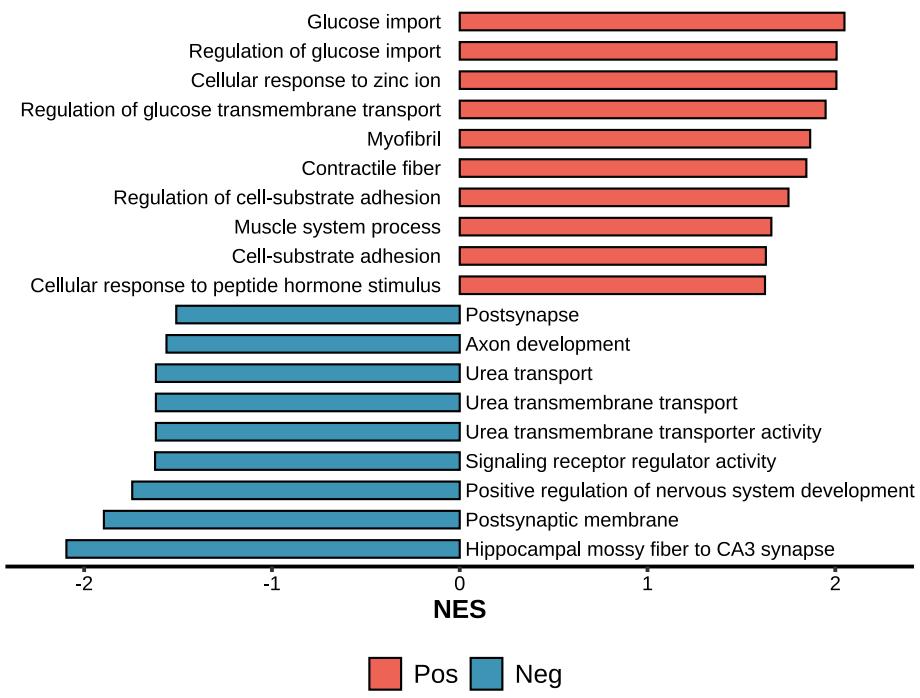
lzq_GSEA.barplot1(enrich.obj = fit2$simplyGO,type = 'pos')Enrichment dotplot for positive or negative GSEA results
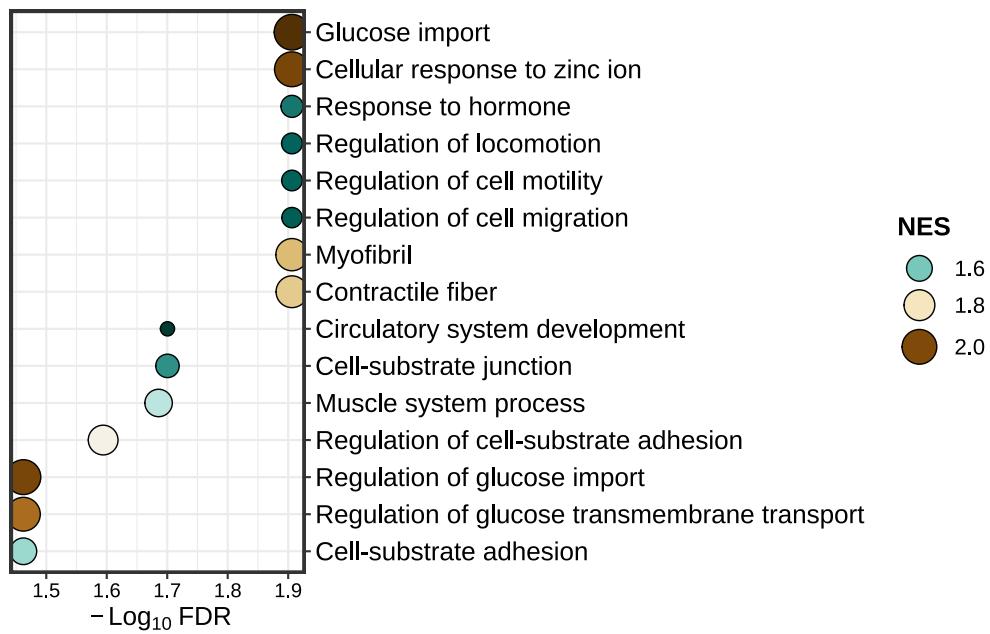
lzq_GSEA.dotplot1(enrich.obj = fit2$simplyGO,type = 'pos')lzq_GSEA.barplot2(enrich.obj = fit2$simplyGO)lzq_GSEA.barplot2(enrich.obj = fit2$simplyGO,use.Chinese = T)Note: use.Chinese exists all the plot functions.
