All the figures from the paper Expanding the UniFrac toolbox, submitted to Great Lakes Bioinformatics and the Canadian Computational Biology Conference 2016 (https://www.iscb.org/glbioccbc2016)
The paper can be found here: https://github.com/ruthgrace/unifrac_paper
In this repository, the scripts often use the same data sets, so the data sets are stored separately in the data folder.
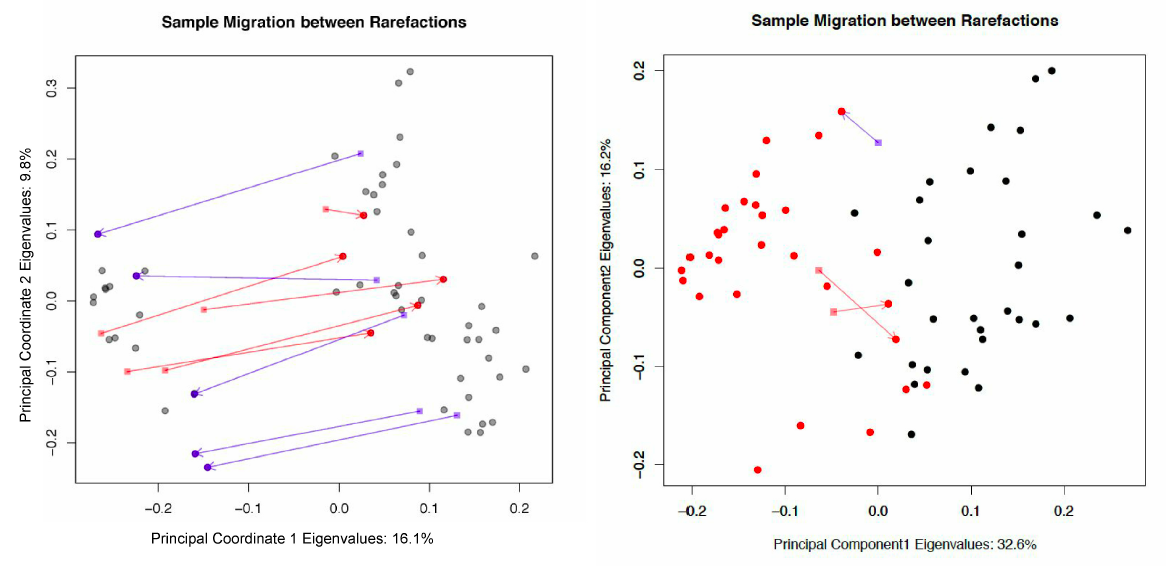
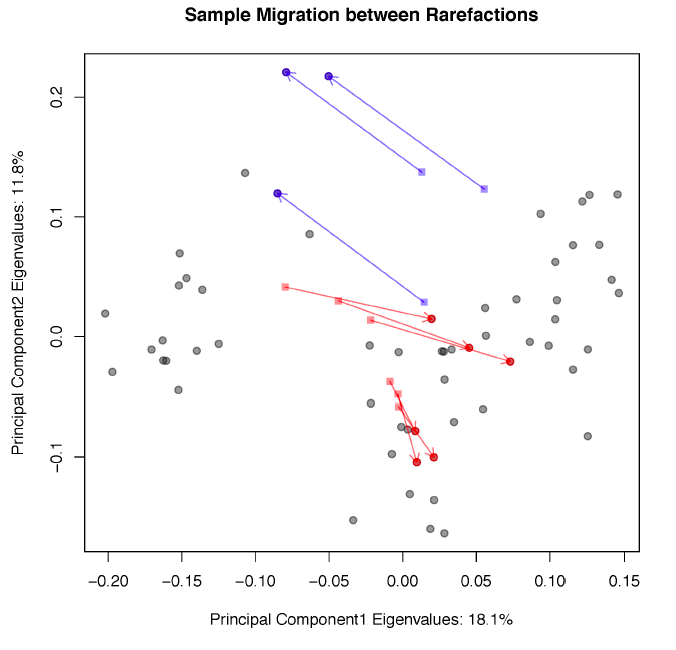
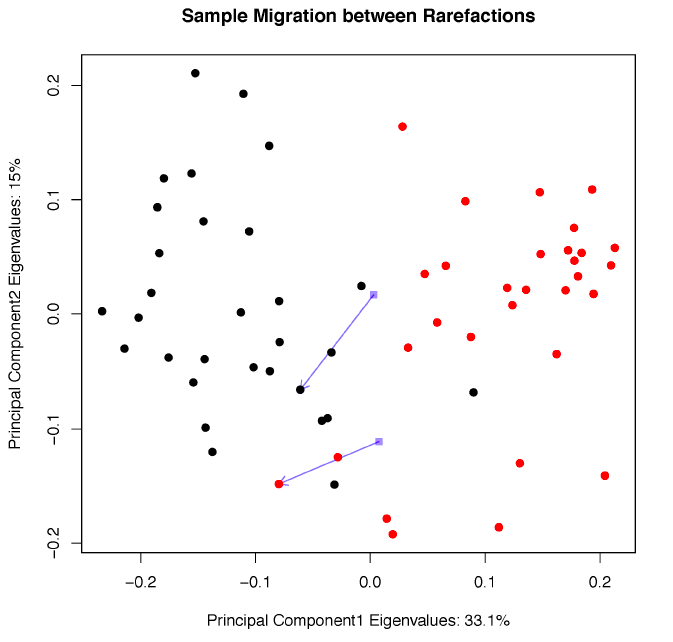
Sample migration in different rarefactions, plotted on principal coordinates, measured with unweighted UniFrac.
Tongue dorsum sample migration code
Tongue dorsum vs. buccal mucosa sample migration code
Output:
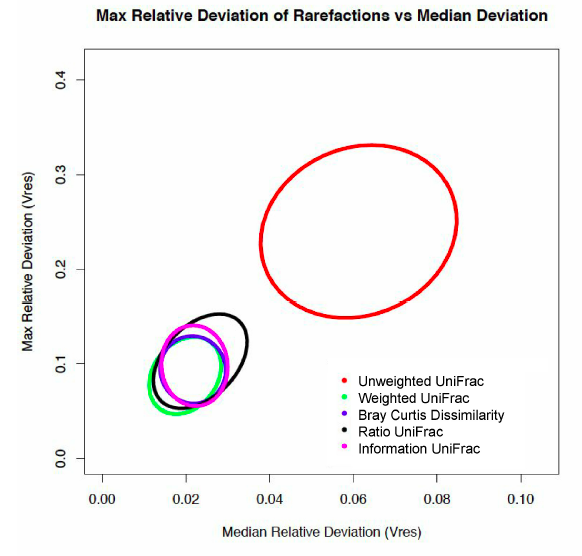
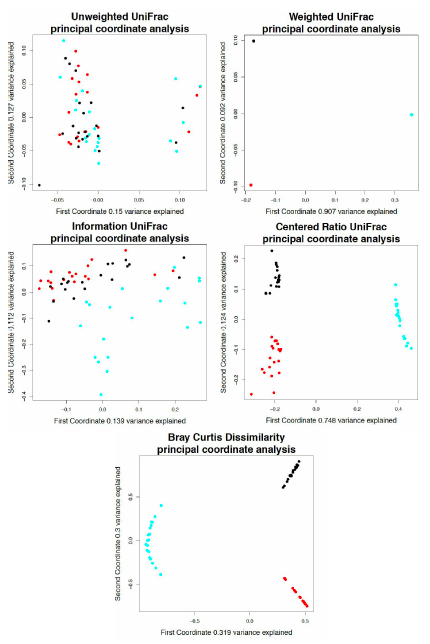
Maxiumum relative deviation of rarefactions versus median deviation for traditional and non-traditional microbiome dissimilarity metrics.
Output:
Output:
Output:
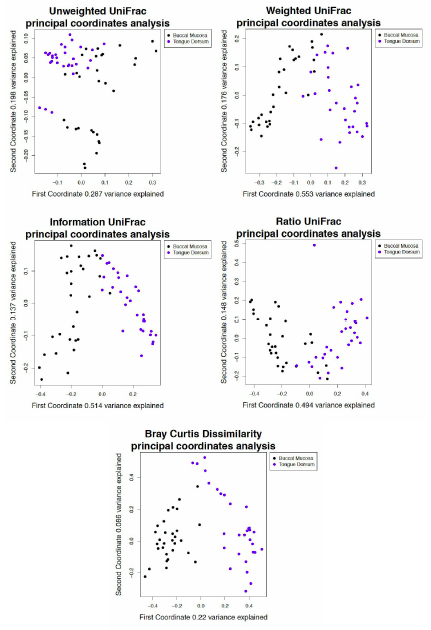
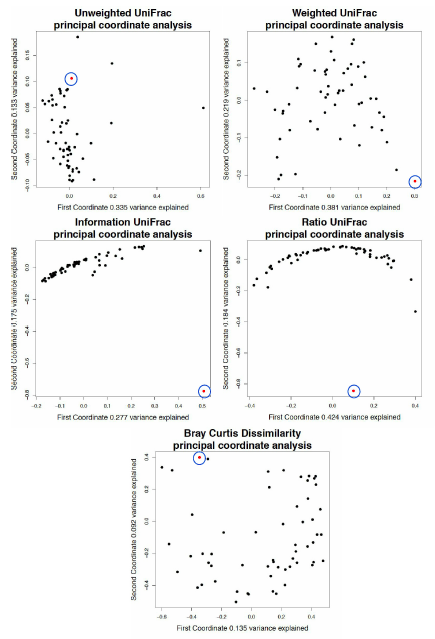
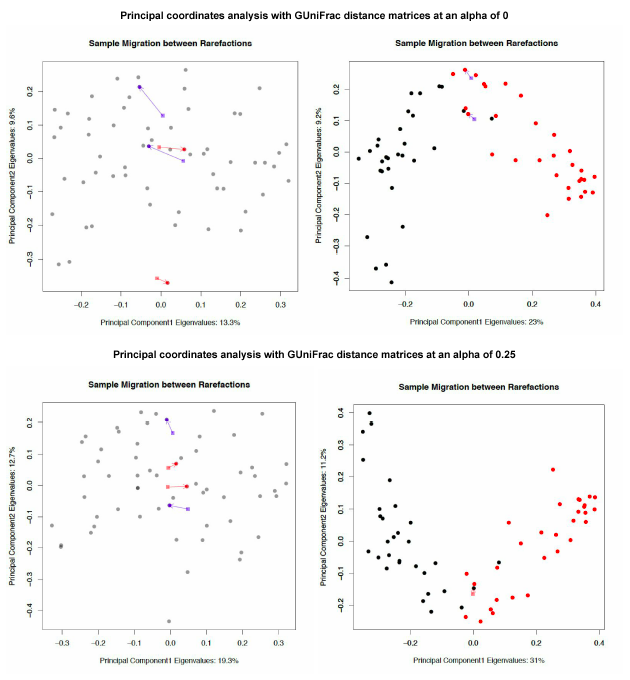
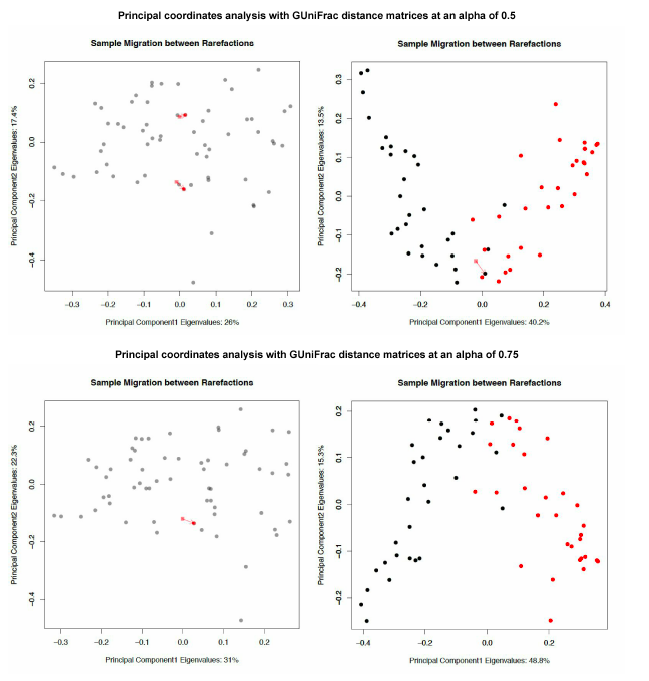
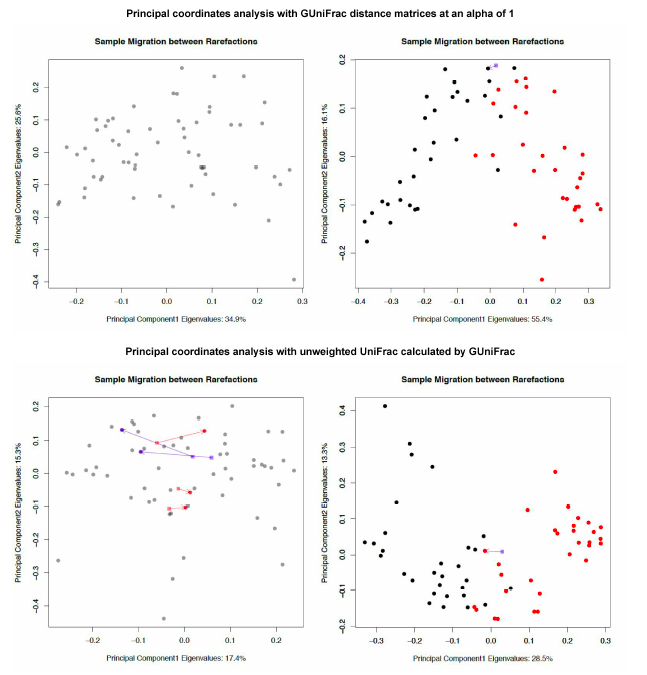
These figures are in the supporting information section.
GUniFrac sample migration plot code
Output:
Principal coordinate analysis derived from tongue dorsum samples using unweighted UniFrac distance matrices with no tree pruning.
This figure is in the supporting information section.
Tongue dorsum sample migration without tree pruning plot code
Output:
Principal coordinate analysis derived from tongue dorsum and buccal mucosa samples using unweighted UniFrac distance matrices with no tree pruning.
This figure is in the supporting information section.
Tongue dorsum vs. buccal mucosa sample migration without tree pruning plot code
Output:
