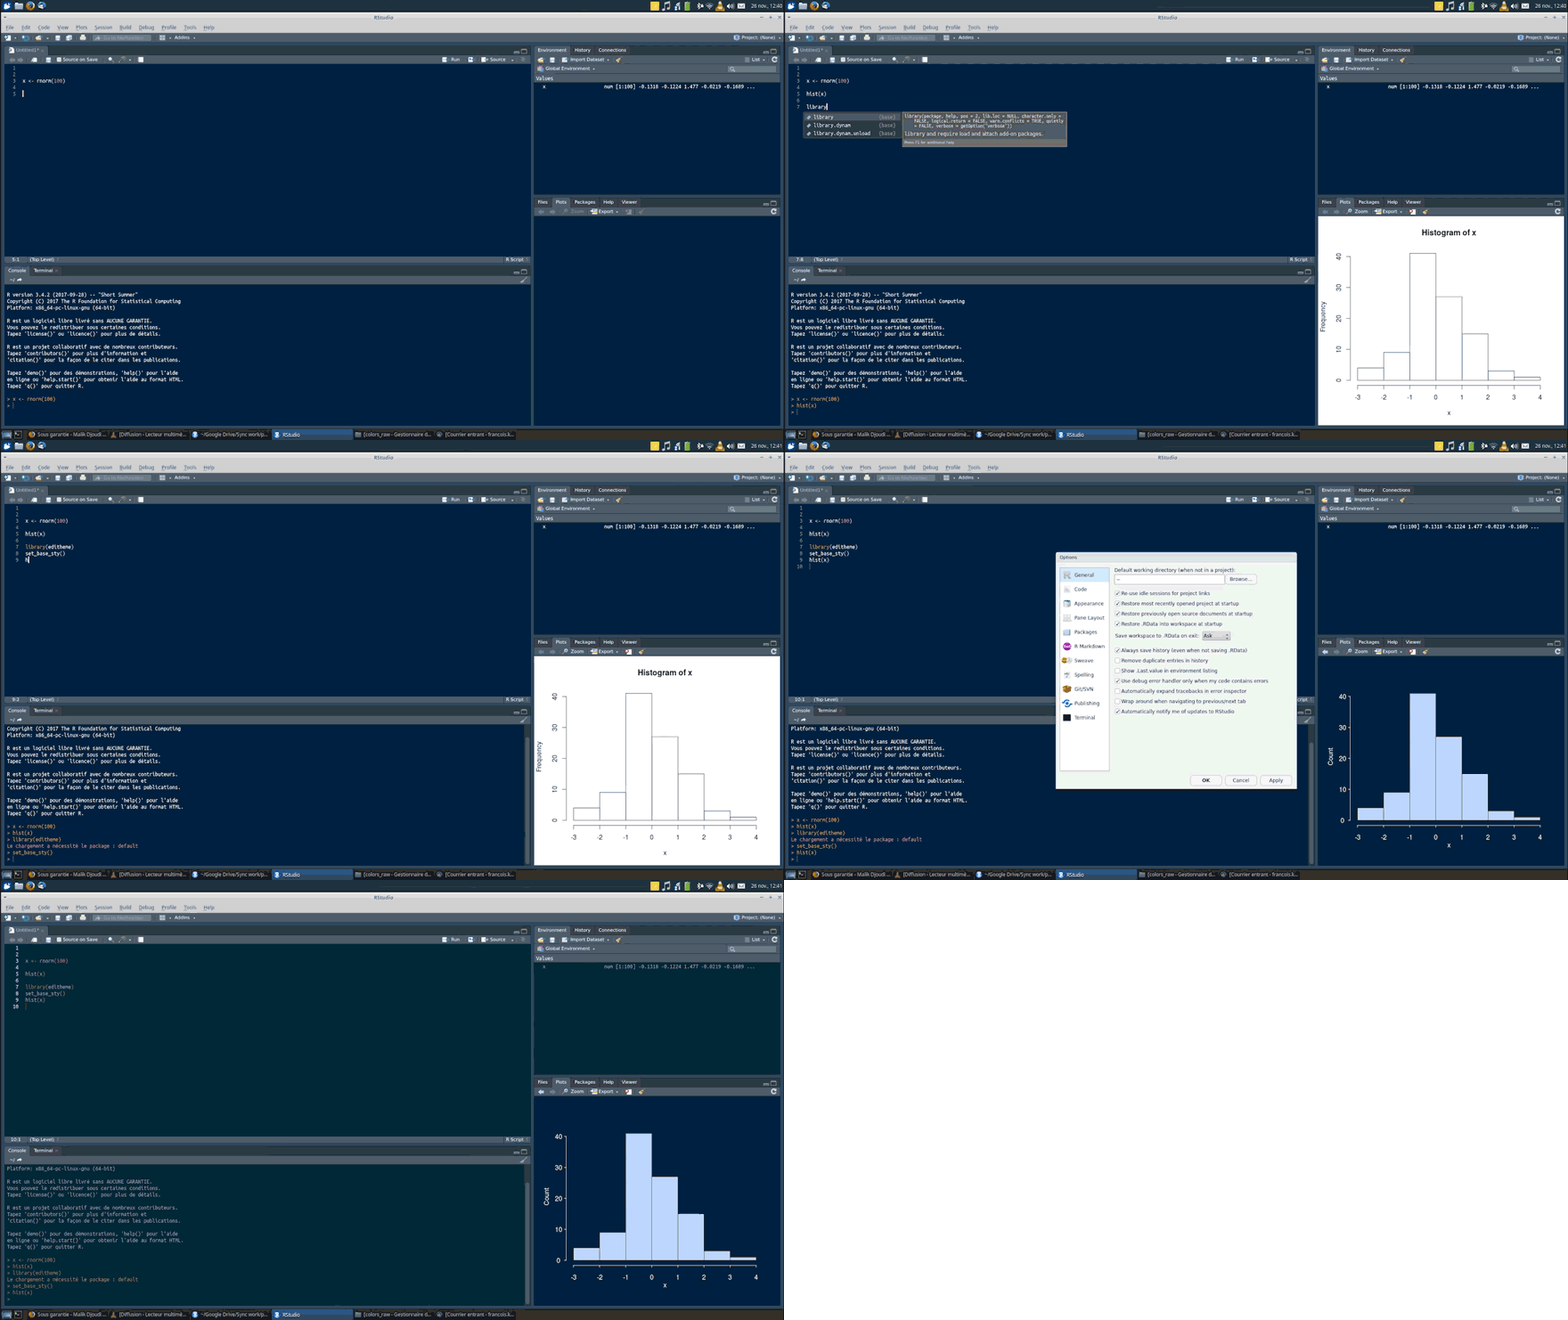
The package editheme provides a collection of color palettes designed to match the different themes available in RStudio. It also includes functions to customize 'base' and 'ggplot2' graphs styles in order to harmonize the look of your favorite IDE.
To install the package from Gihub you can use devtools:
#editheme use the package styles to customize base plots
devtools::install_github("ropenscilabs/styles")
devtools::install_github("fkeck/editheme")library(default)
#> Warning: package 'default' was built under R version 3.3.3
library(editheme)Print the list of available palettes with list_pal:
list_pal()
#>  [1] "Ambiance"              "Chaos"
#>  [3] "Chrome"                "Clouds"
#>  [5] "Clouds Midnight"       "Cobalt"
#>  [7] "Crimson Editor"        "Dawn"
#>  [9] "Dracula"               "Dreamweaver"
#> [11] "Eclipse"               "Idle Fingers"
#> [13] "Katzenmilch"           "Kr Theme"
#> [15] "Material"              "Merbivore"
#> [17] "Merbivore Soft"        "Mono Industrial"
#> [19] "Monokai"               "Pastel On Dark"
#> [21] "Solarized Dark"        "Solarized Light"
#> [23] "TextMate"              "Tomorrow"
#> [25] "Tomorrow Night"        "Tomorrow Night Blue"
#> [27] "Tomorrow Night Bright" "Tomorrow Night 80s"
#> [29] "Twilight"              "Vibrant Ink"
#> [31] "Xcode"
Get one specific palette with get_pal and visualize it with viz_pal:
my_pal <- get_pal(theme = "Twilight")
viz_pal(my_pal, print.hex = TRUE)
get_pal is smart, if you are using RStudio, it can find automatically the palette matching your current theme using rstudioapi, just type:
get_pal()To change the look of base graphics editheme uses the styles package. The function set_base_sty modifies the graphical parameters and the behavior of different plotting functions according to the selected theme.
set_base_sty("Clouds Midnight")
par(mfrow = c(2, 3))
hist(rnorm(100))
plot(iris$Sepal.Length, iris$Petal.Length)
barplot(1:9, names.arg = LETTERS[1:9])
boxplot(iris$Sepal.Length ~ iris$Species)
image(volcano)
Tip: Just like get_pal, set_base_sty is smart. If you are using RStudio, it can find automatically your current theme. Just type: set_base_sty()
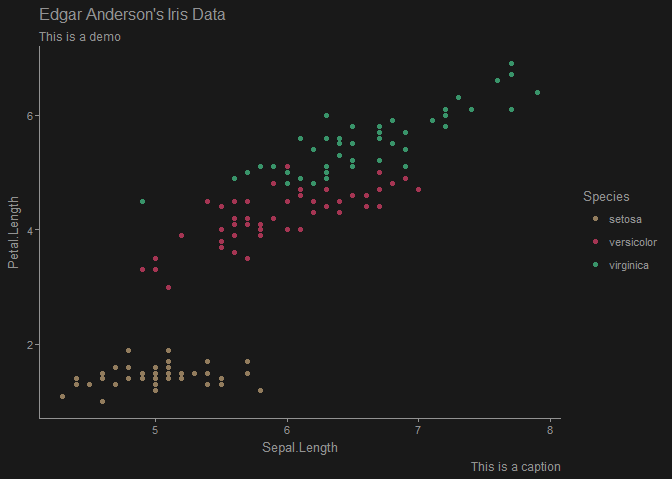
The package provides a ggplot2 theme function theme_editor and scales functions (scale_color_editor, scale_fill_editor) to control the appearance of the plot.
library(ggplot2)
#> Warning: package 'ggplot2' was built under R version 3.3.3
pal <- get_pal(theme = "Clouds Midnight")

ggplot(iris, aes(Sepal.Length, Petal.Length)) +
  geom_point(color = col_fg(pal, fade = 0.2)) +
  geom_smooth(color = pal[1], fill = pal[2]) +
  labs(title = "Edgar Anderson's Iris Data",
    subtitle = "This is a demo", caption = "This is a caption") +
  theme_editor("Clouds Midnight")
#> `geom_smooth()` using method = 'loess'ggplot(iris, aes(Sepal.Length, Petal.Length, color = Species)) +
geom_point() +
labs(title = "Edgar Anderson's Iris Data",
subtitle = "This is a demo", caption = "This is a caption") +
theme_editor("Clouds Midnight") +
scale_color_editor("Clouds Midnight")Tip: ggplot2 theme functions can find automatically your current theme. Just type: theme_editor(), scale_color_editor(), etc...


