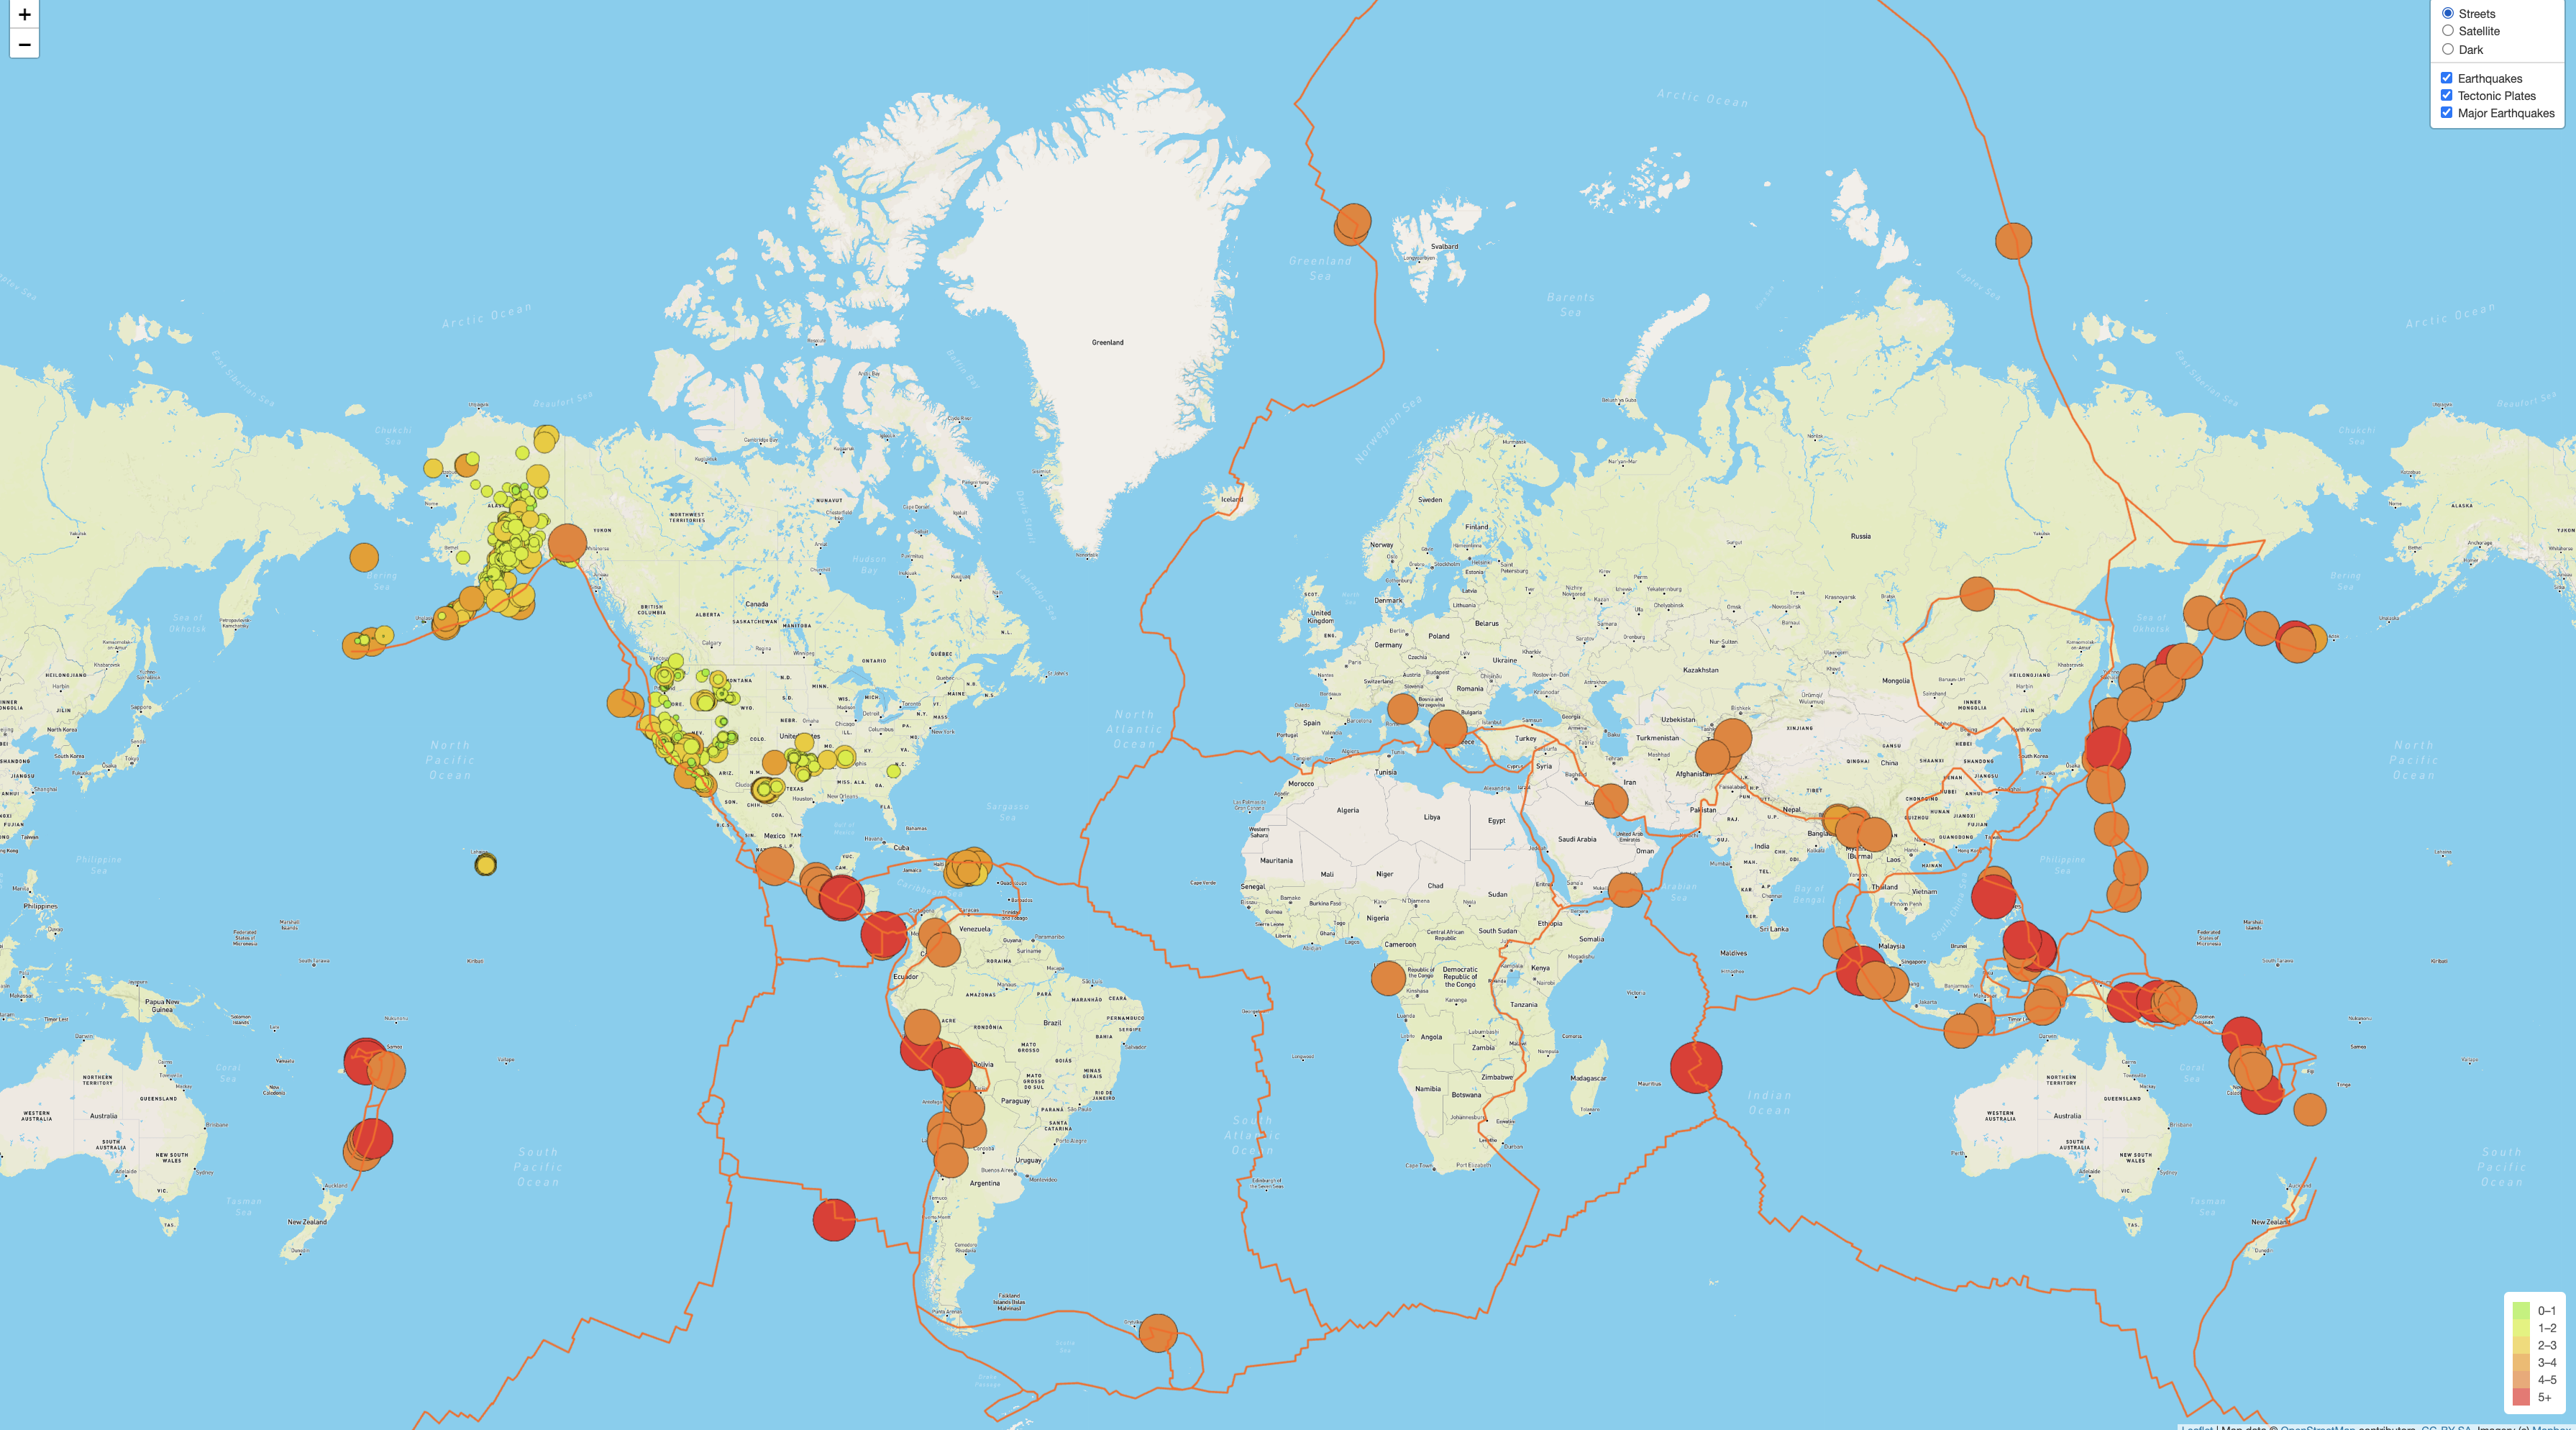
The purpose of this project is to visually show the differences between the magnitudes of earthquakes all over the world for the last seven days.
The Leaflet.js API was used to populate the geographical map with GeoJSON earthquake data from a URL. Each earthquake is visually represented by a circle and color, where a higher magnitude has a larger diameter and darker in color.
Additionally, each earthquake has a popup marker that, when clicked, it shows the magnitude and location of the earthquake. Multiple layers will be added using Leaflet control plugins to add user interface controls.
JavaScript, Leaflet.js, and GeoJSON data was used to build the maps. To retrieve geographical coordinates and magnitudes of the earthquakes from the GeoJSON data, we used the JavaScript and D3.js library. Leaflet.js library was used to plot the data on a Mapbox map through an API request, and create interactivity for the earthquake data. The data was extracted from the following websites:
-
https://github.com/fraxen/tectonicplates/blob/master/GeoJSON/PB2002_boundaries.json
-
https://earthquake.usgs.gov/earthquakes/feed/v1.0/summary/4.5_week.geojson
-
https://earthquake.usgs.gov/earthquakes/feed/v1.0/summary/all_week.geojson
The tectonic plate data was added to the layer group, the overlay object, and the map. When the webpage loads, the earthquake and tectonic plate data is displayed. The major earthquake data was added as third layer group, and added to the map and styled. A third map layer tile (dark-v10) layer was created and added to the overlay object.
All the earthquake data and tectonic plate data is beautifully displayed on all maps on the webpage.


