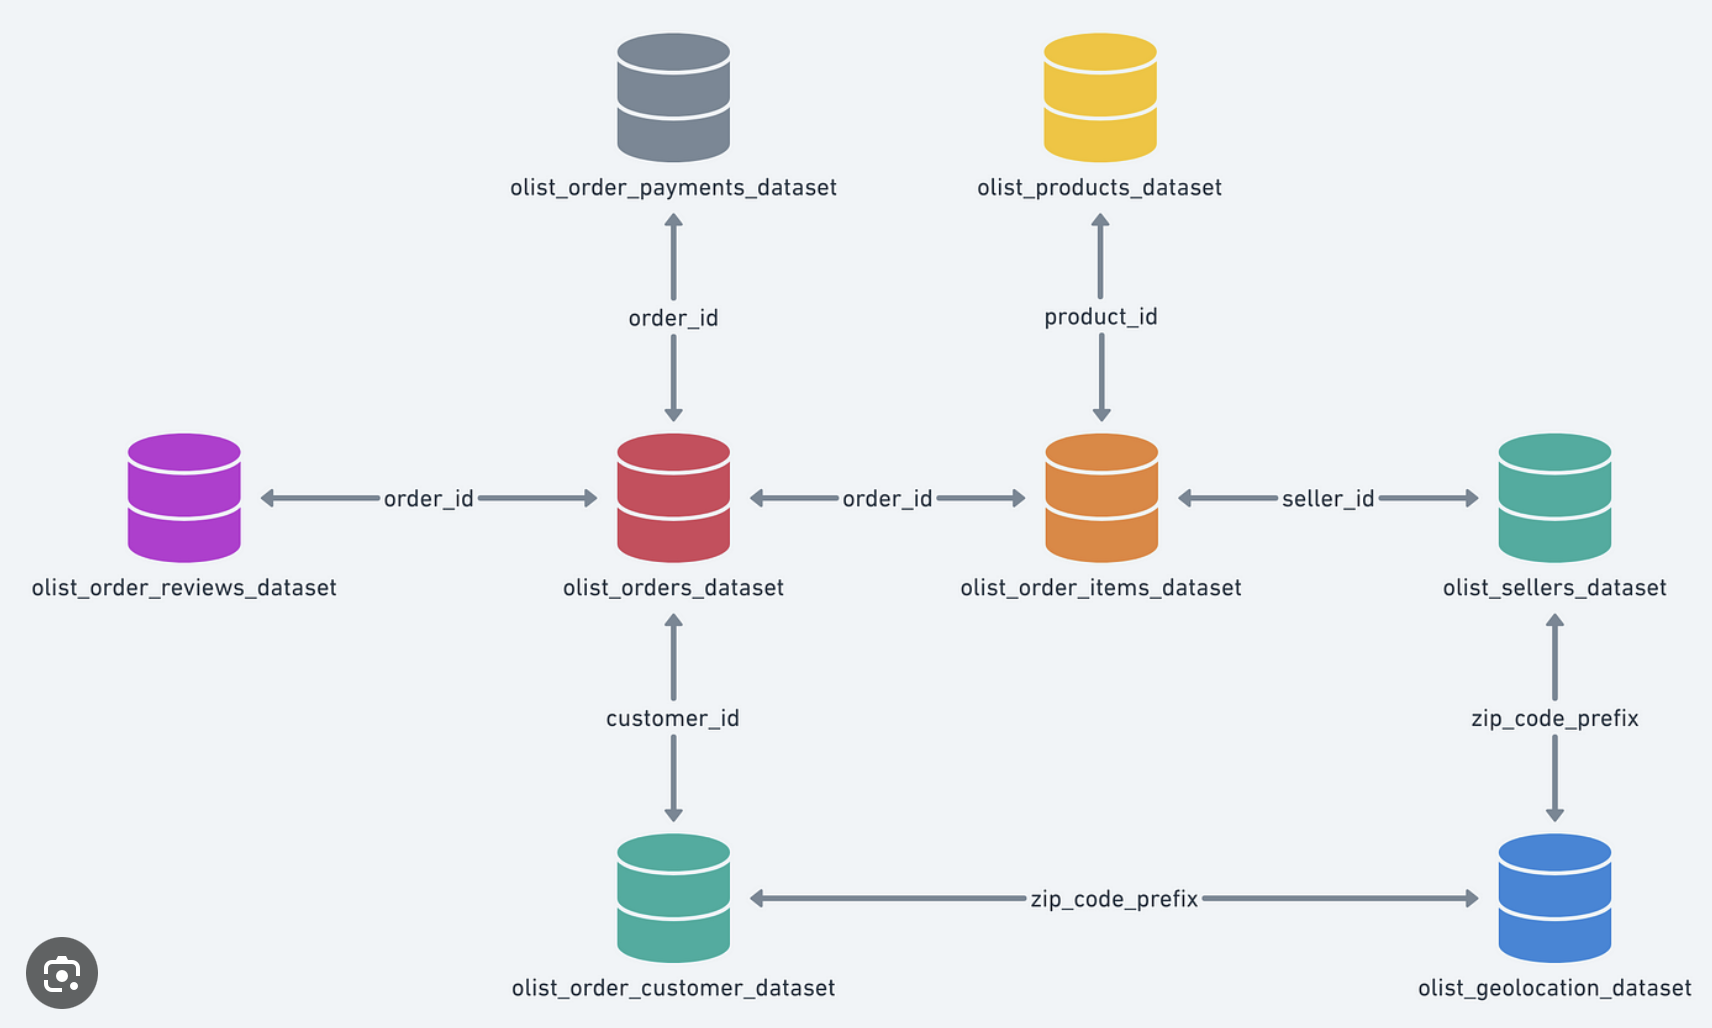
This is a public dataset on Kaggle Platform. It was generously provided by Olist which is the largets department store in Brazil. Small businesses are connected by Olist across Brazil to channels without hassle and with a single contract. Those small business can sell their products through the Olist Store and products are directly shipped to the customers by Olist logistics partners. See more details on the website: www.olist.com. After a customer place his order from Olist Store, notification sent to seller to let seller complete that order. Once customer receive their product, or after the delivery date, customer could fill in a satisfaction survey by email where he could write down his purchase experience and comments here.
- Pycharm
- Python 3
- MySQL / AWS S3
- PowerBI/Tableau
- Packages needed: Please See requirements.txt
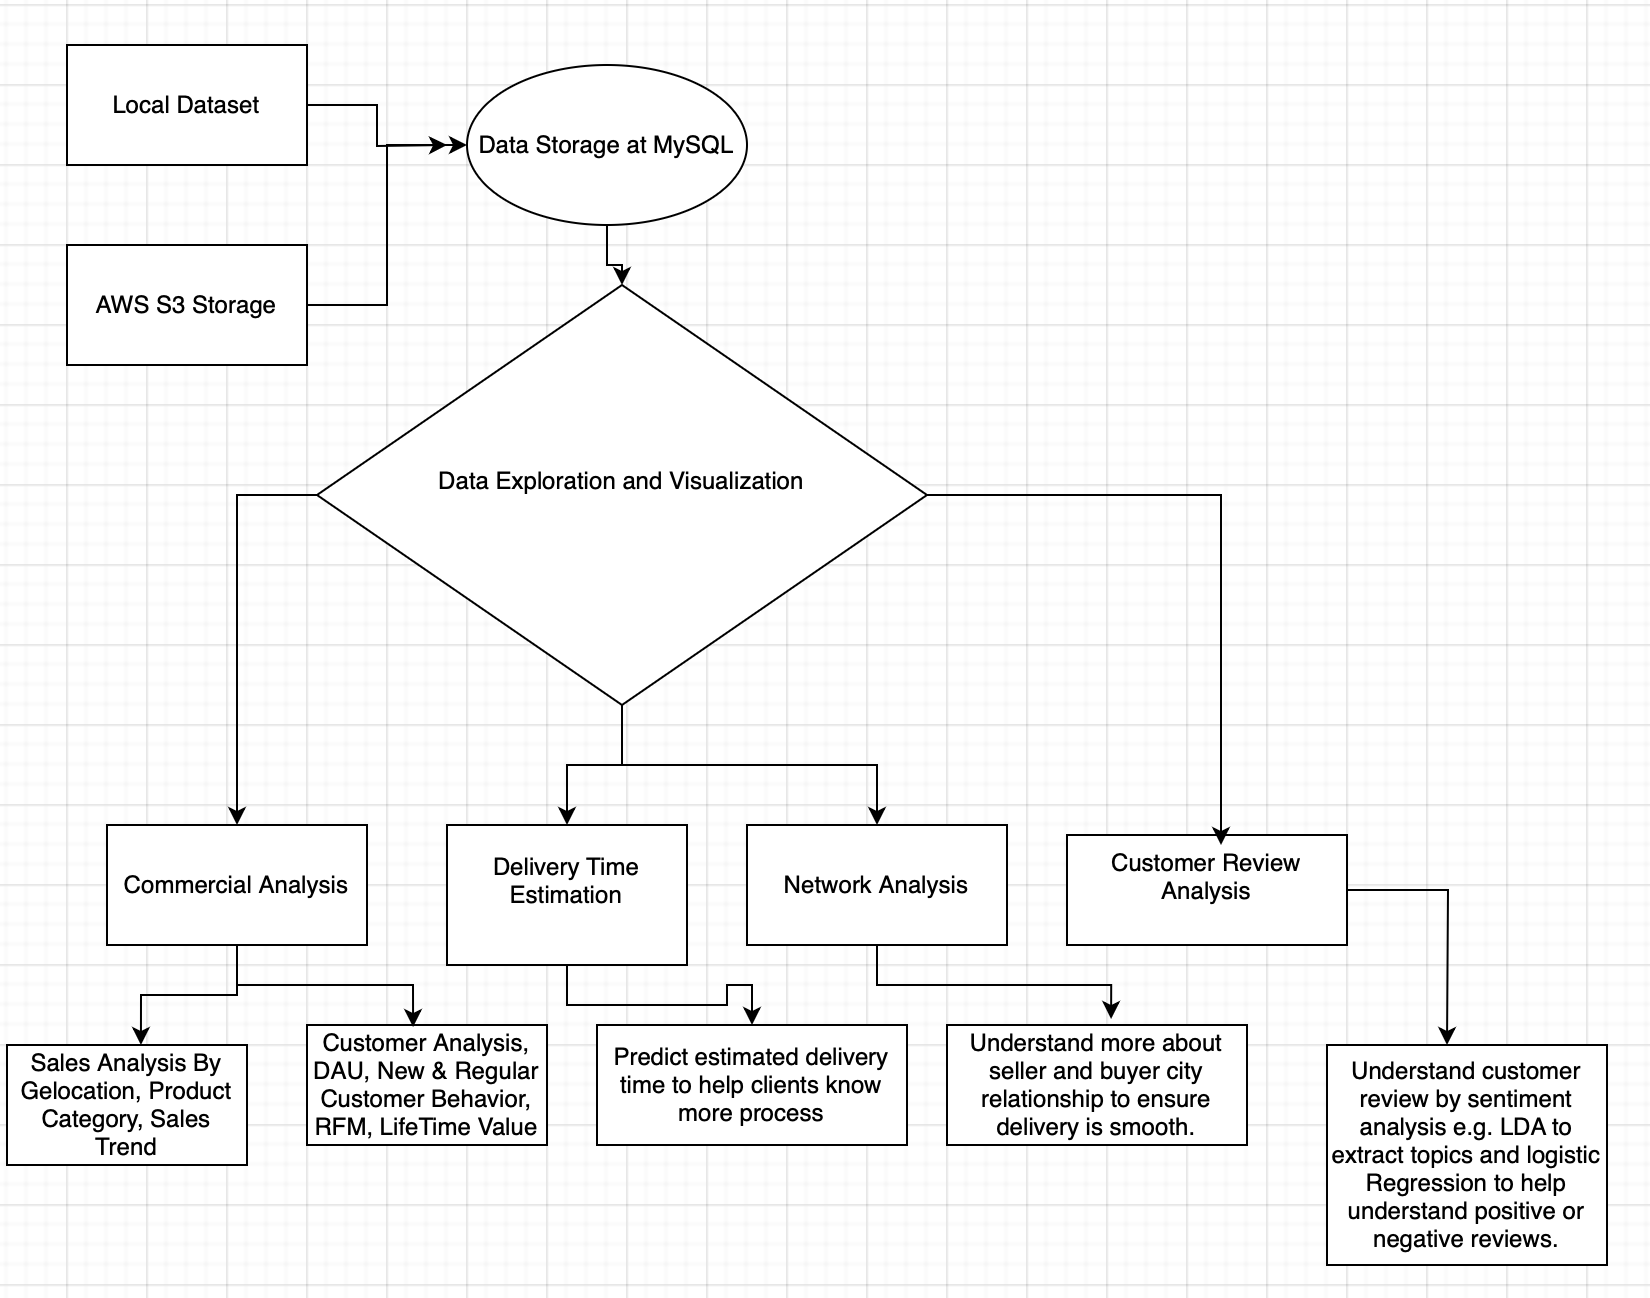
Tables are merged together to form master dataframe. Sales are analysed by different perspective such as gelocatoin, prodcut category as well as its trend.
In addition, customer part is dived deeper. Daily Active User, yearly New customer as well as regular customer buying behavior are anlaysed. RFM (recency, frequency, and monetary value) and customer lifetime value checked.
-
Speaking of customer city and seller city, taking them as nodes, and frequencies between as edges. Relationship betweem cities are presented in network diagram. For the strong relationship with high connection between cities, more deliveries services could be planned in order to increase customer statistication.
-
But for product association, an adjacnecy matrix are produced between proucts relationship. Association rules are utilised to help sellers have more bundles in order to attract customer in order to increase sales. Association rule could tell you what is the probability of buying this product given if customer have already bought other products.
Reviews left by customers are valuable to improve product quality and service. Bascially, text processing are utilised on customer reviews. In addition, customer reviews could be categorised into different groups by Latent Dirichlet allocation to find out key words by groups. Thus, these key words are indicators for platform to improve customer experience. Finally, Positive or Negative Labels are given by customer review score. Logistic Regression are used to train a model on it to help platform indentify customer review positive or negative.
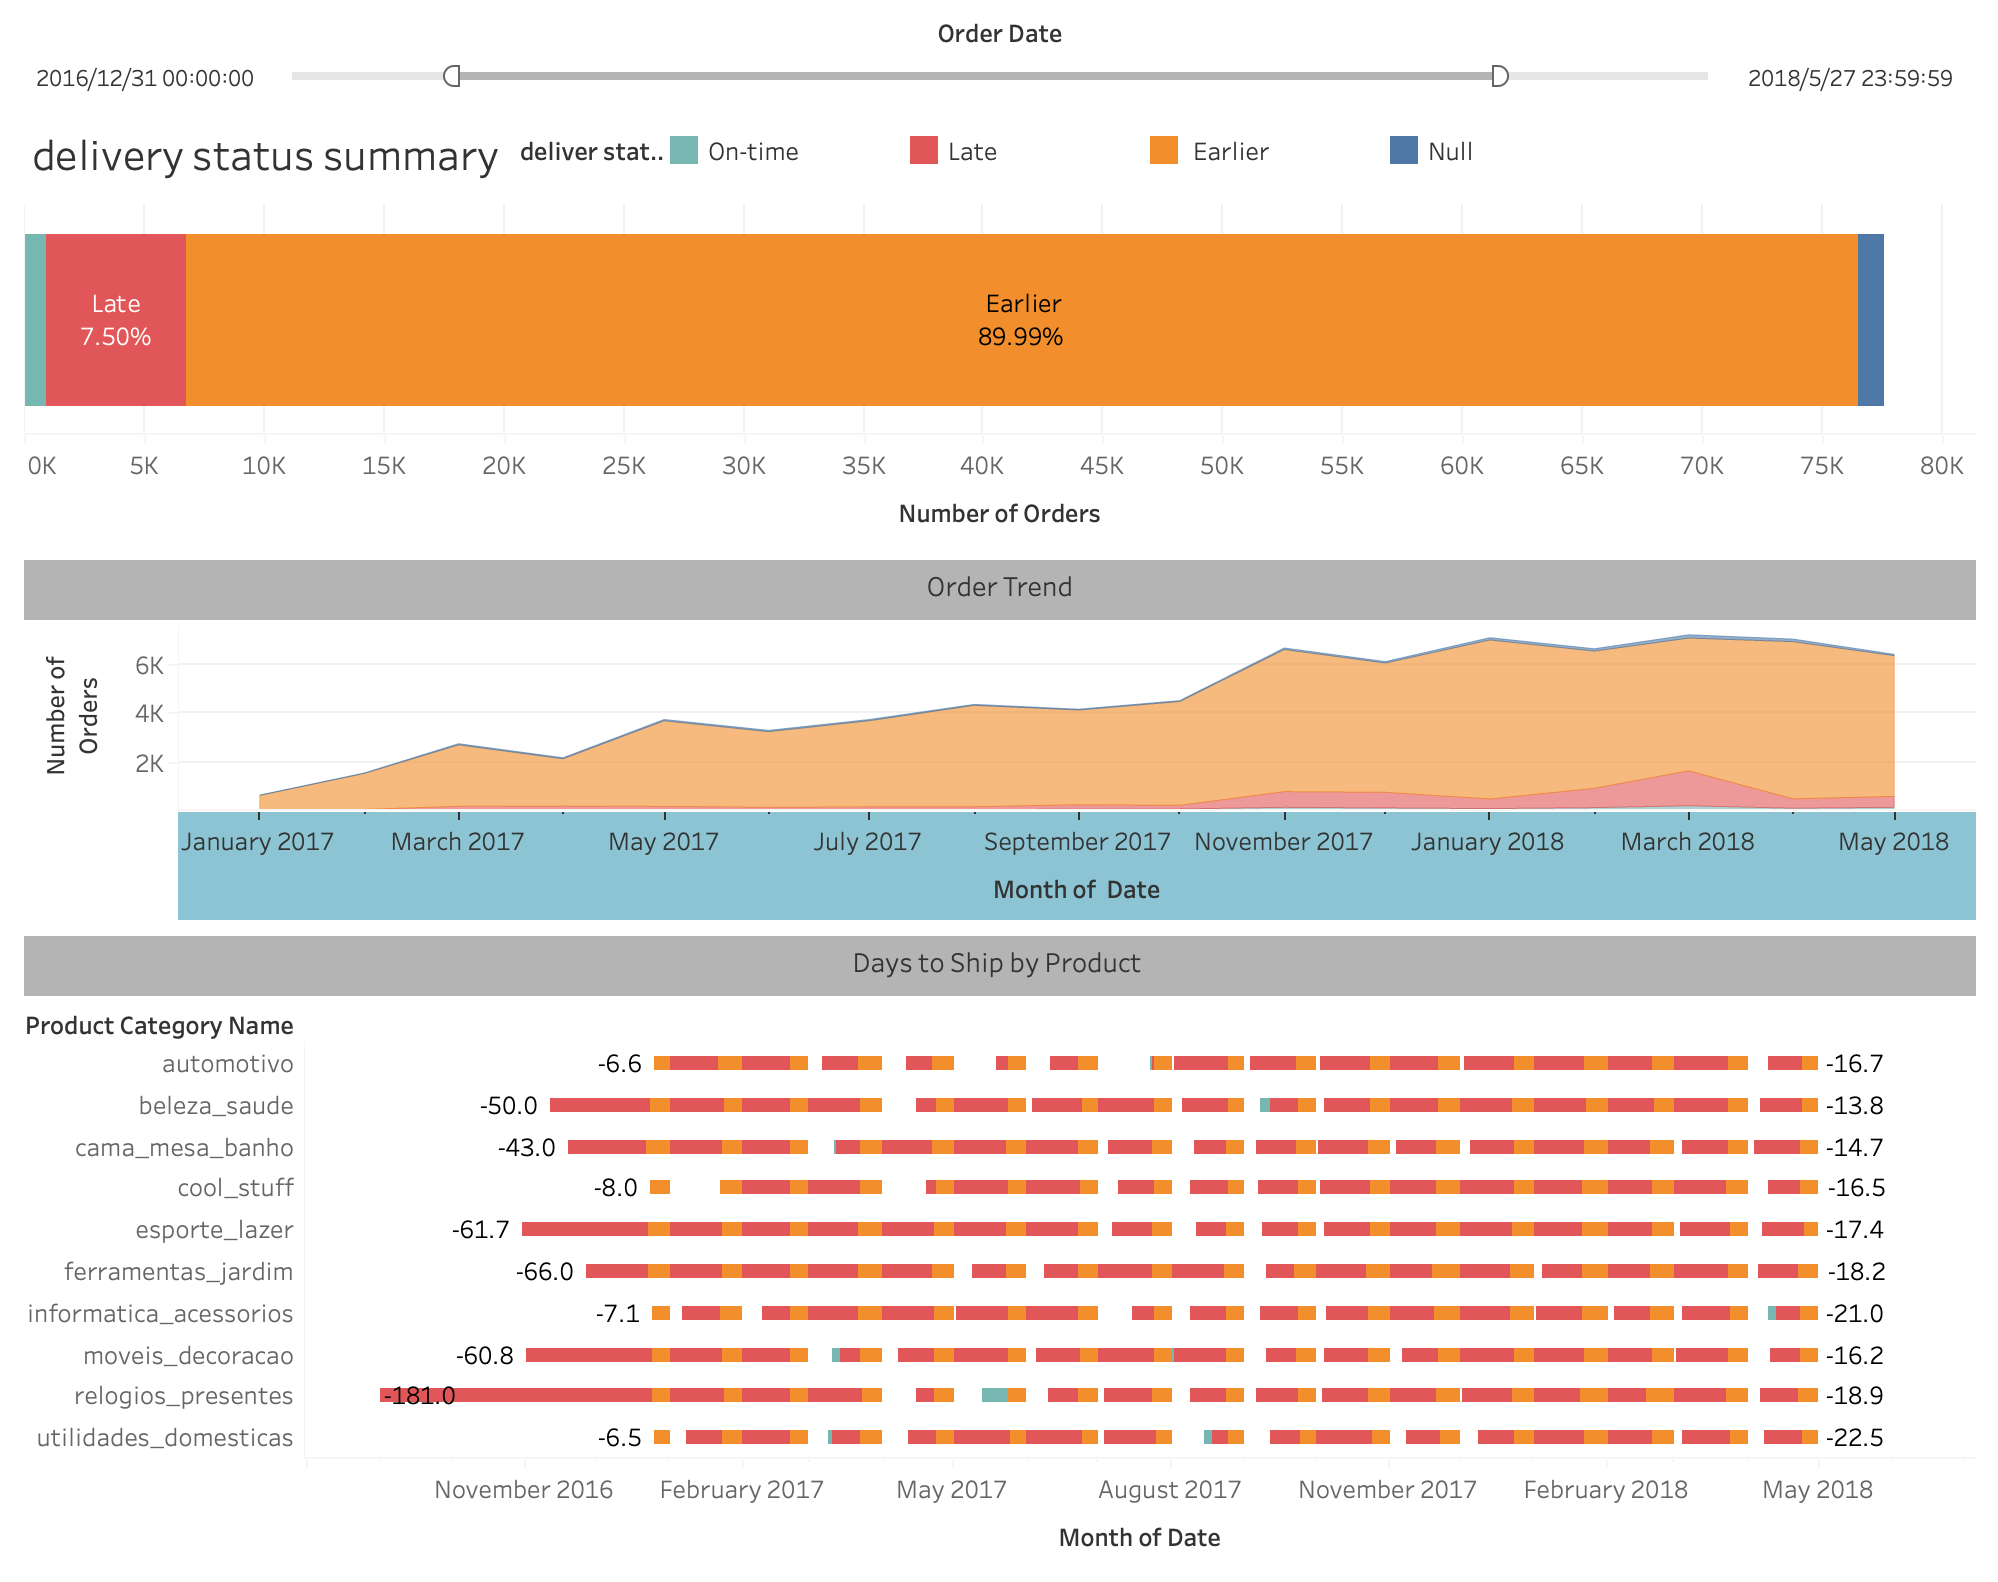
Delivery Estimation could help buyer to understand when they could receive products. With the help of past data, and features added like distance between cities, product volumn and its weight, XGBoost use these features to estimate days needed.


