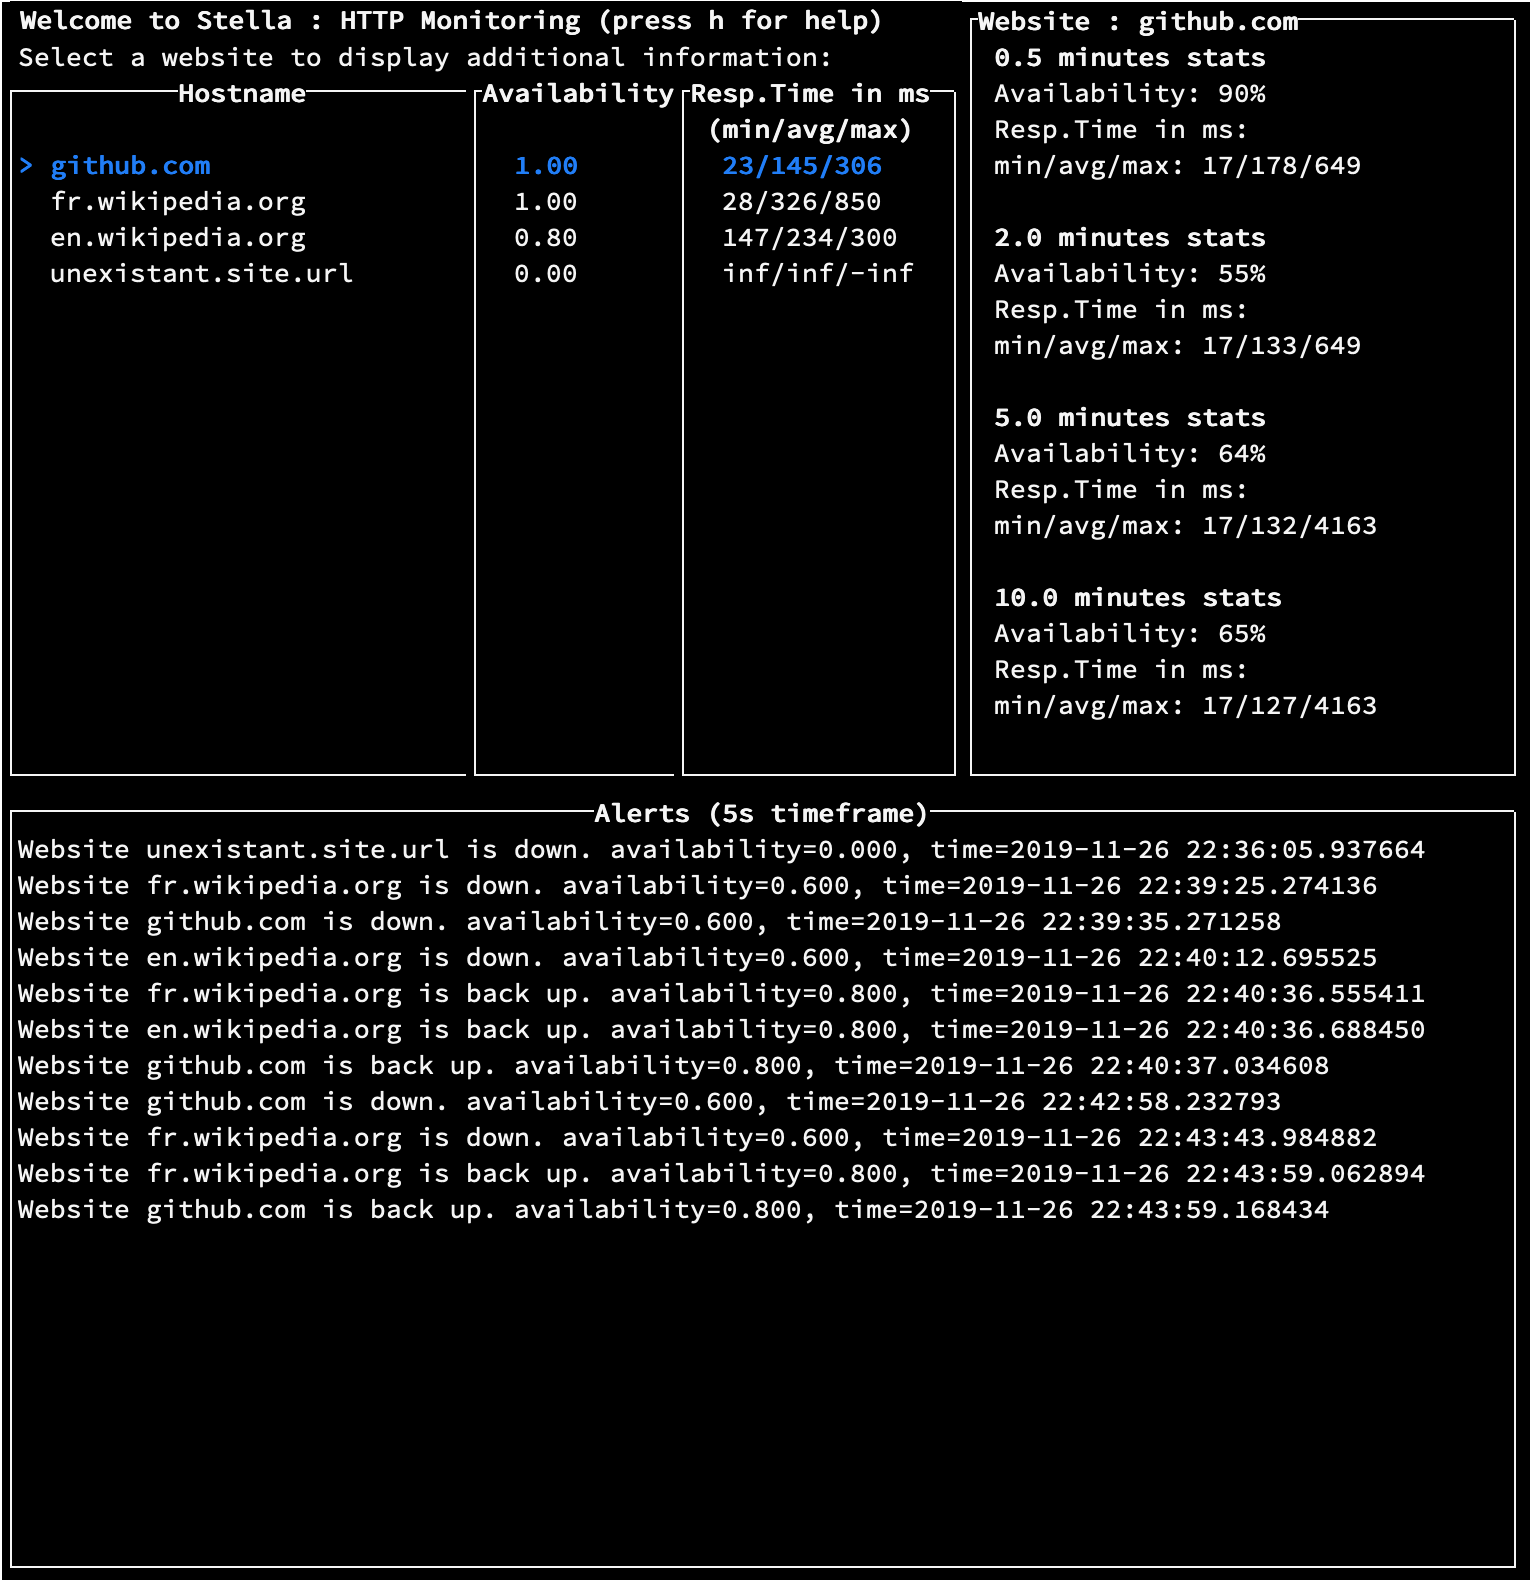
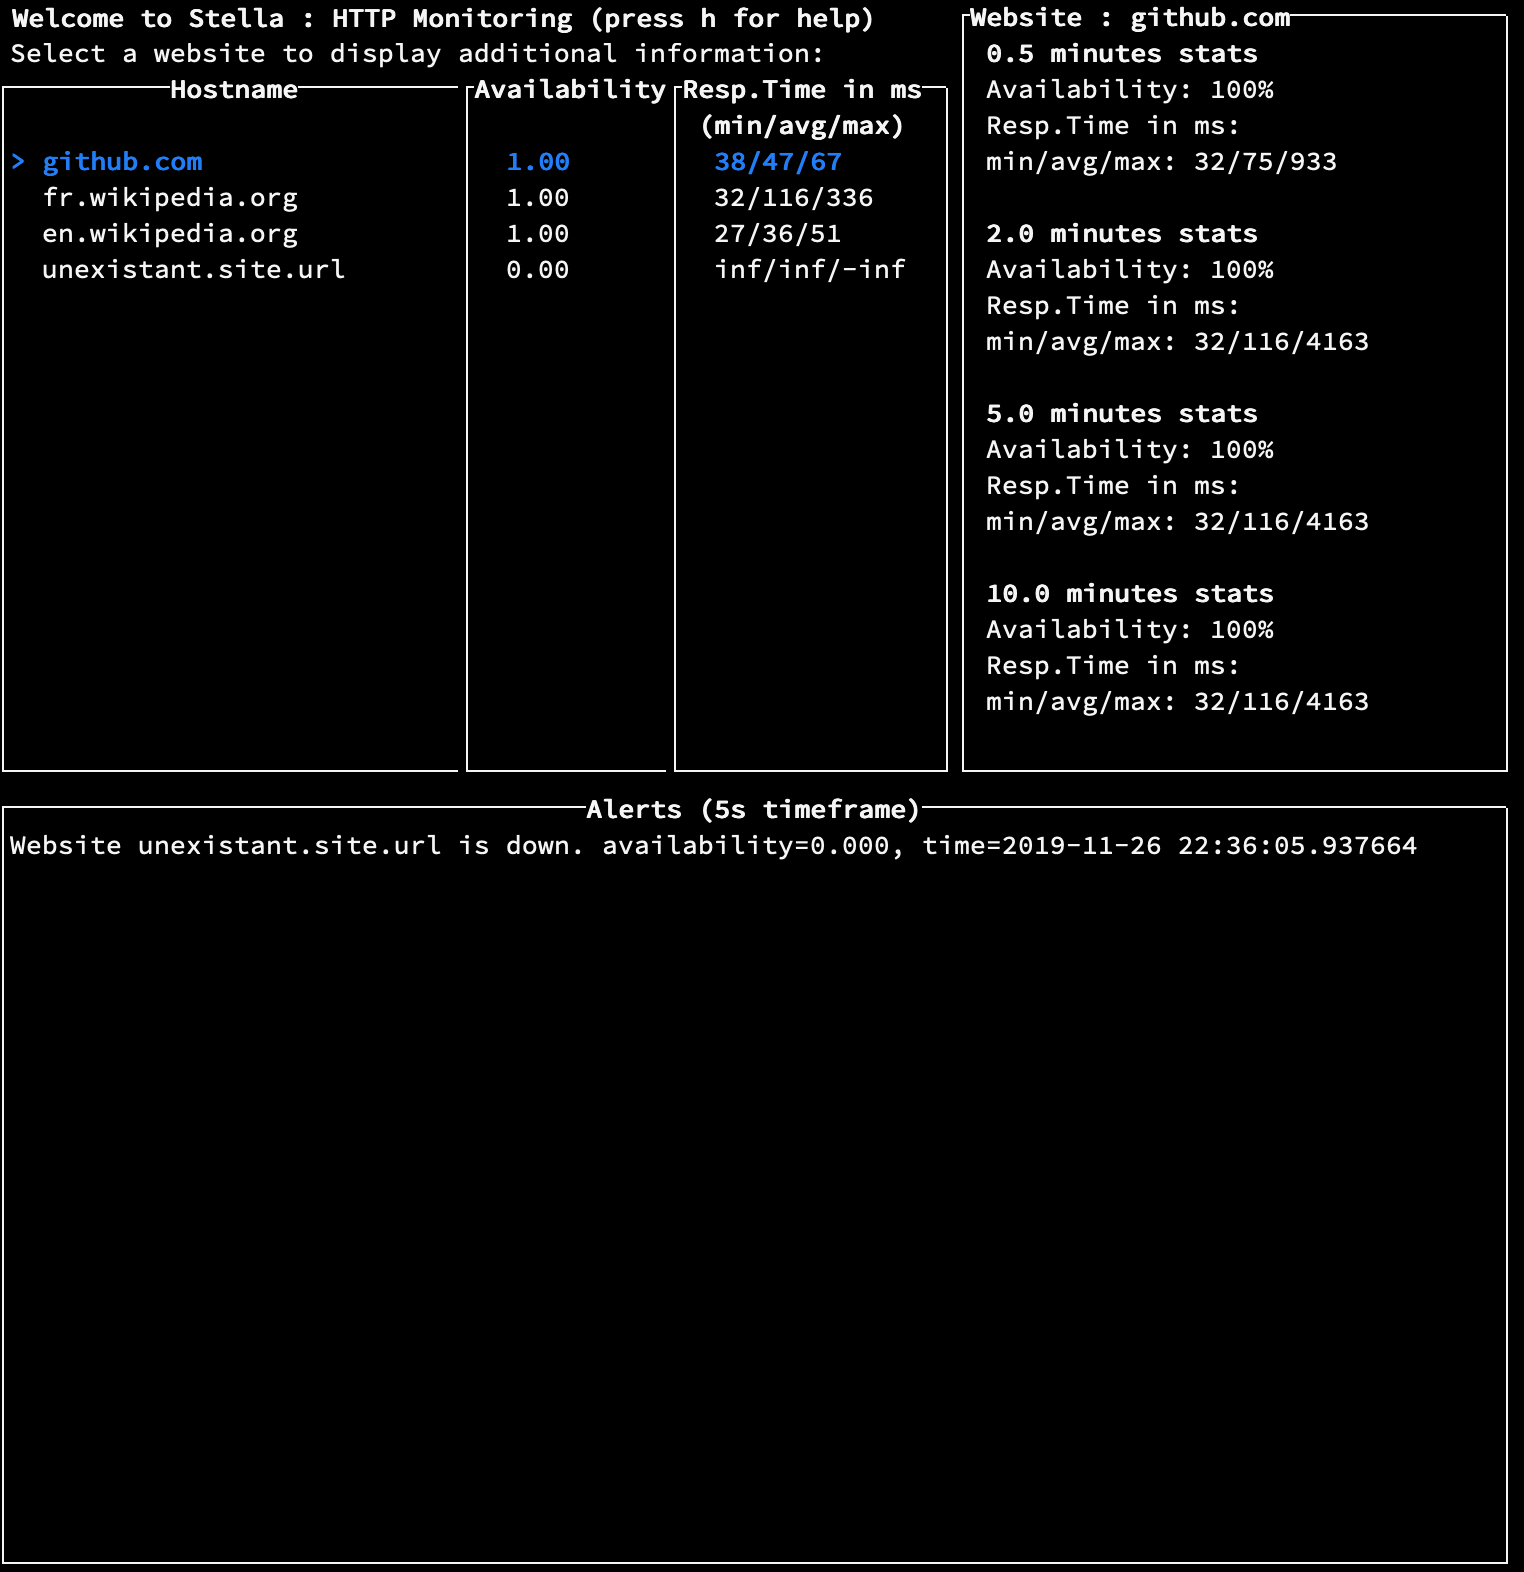
Stella is a console program which monitors availability and performance of websites.
Stella can monitors websites either through HTTP or ICMP.
- Linux, MacOS.
- Python 3.7
- Support for Windows is still experimental and not guaranteed.
This program uses the included curses library. As the regular Windows Python distribution does not include the curses library used for the console dashboard, the windows-curses library is required (and is automatically installed by the installer).
If Stella crashes on startup, ensure your Powershell or Command Prompt window is big enough.
To install from source in a virtualenv:
python setup.py install
-
Modify the websites you would like to monitor in the
websites.conffile. Each line consists of a valid HTTP URL (as described in the RFC 3986), and an integer representing the check interval in seconds (i.e how often to ping the website). Both arguments are separated by a space. You can add any number of websites. -
By default, the app will monitors website through ping. To change this setting, set
MONITOR_HTTP_RATHER_THAN_ICMPtoTruein the Stella configuration file (stella/config.py). Note that some sites may have DDoS Protection when using http monitoring that will quickly block low check interval http probing (for examplegithub.com). -
By default, the app will compute and display stats (such as averages) based on certain timeframes. You can change them or add any number of timeframes in the
STATS_TIMEFRAMESin the configuration file. -
The app will send alerts when the website availability during a certain timeframe (the
ALERTING_TIMEFRAME) drops below a given threshold (theDEFAULT_ALERT_THRESHOLD) in the configuration file.
Note: You may have to run python setup.py install again for the changes in the stella/config.py file to be applied to your installation. See Running without installation if you wish to modify the config file often.
- Run
stellato launch the app once you have configured it to your need. - The app has a main window where you can see for each websites the metrics used for the alerting, as well as all the alerts for the application
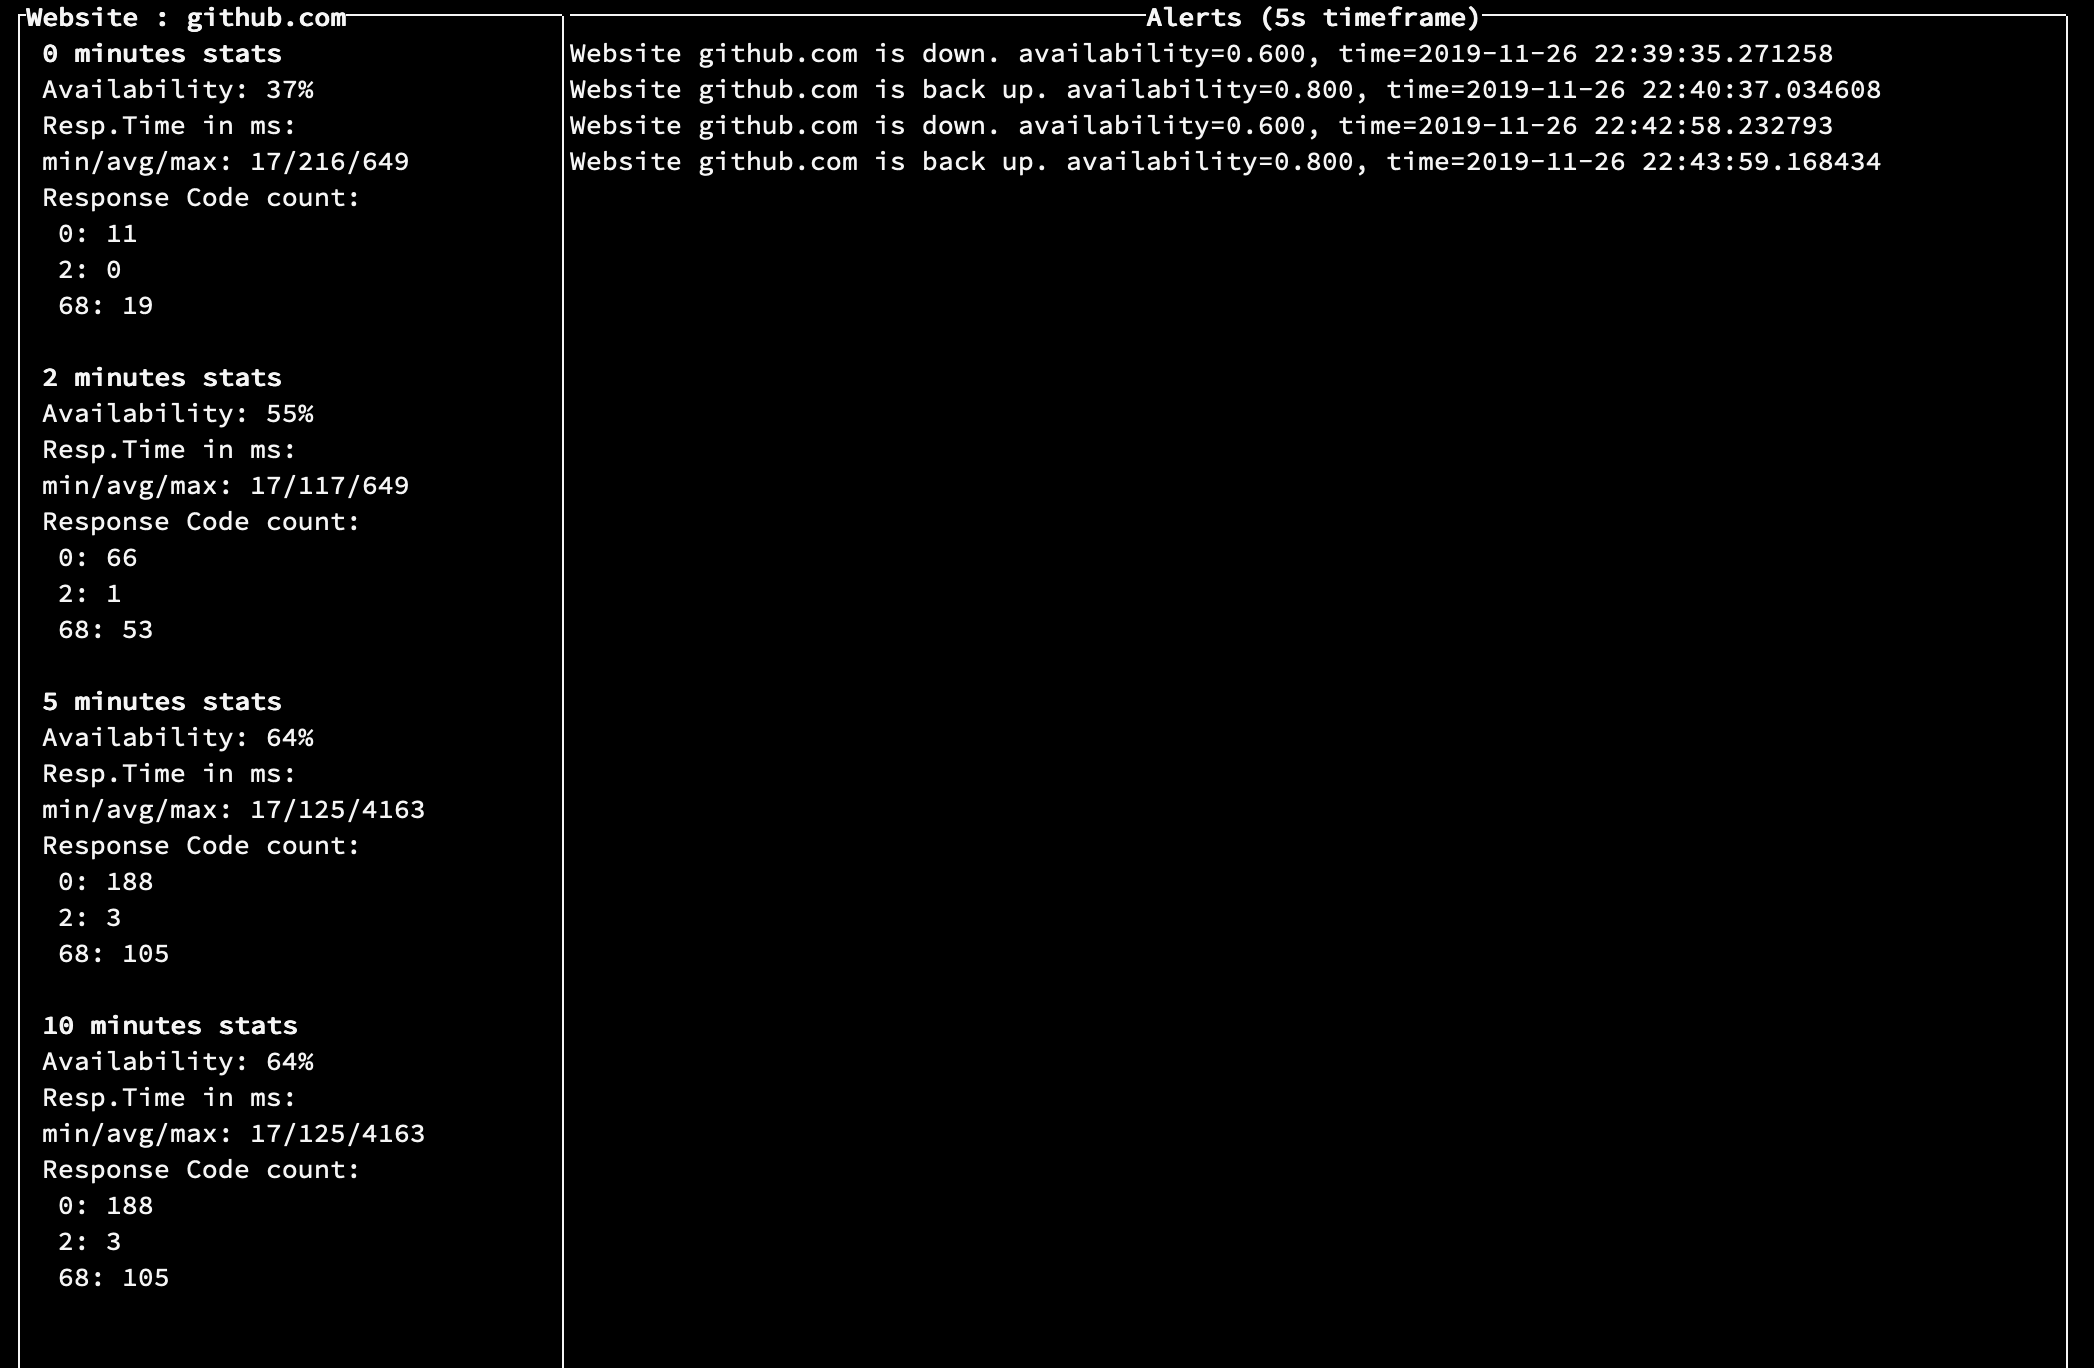
- You can also review the detail of all the gathered metrics for each website by selecting it and pressing
Enter - A help menu can help you if you get lost.
pip install -r requirements.txt- Run
pytest
If you do not want to install the program:
- run stella with
python main.py(no dependencies) - run tests with :
pip install -r requirements.txtthenpython -m pytest
The architecture is divided into 3 main components:
- The App, which acts as the program controller.
- The Dashboard, which presents information to the user.
- Several Websites, which contain a Stats object per
STATS_TIMEFRAMES
The App runs a monitoring thread per Website, which fetches new data (by pinging the server) at each website's given check_interval, updates several website stats, and eventually creates an Alert.
Each new ping and update is in O(1), appart for the edge case where the maximum (or minimum) of a metric needs to be recomputed, because the maximum corresponded to an old data.
The Dashboard is based on the curses library, and refreshes upon user input, or every so often (see CONSOLE_REFRESH_INTERVAL).
The access to all of the stats dispalyed is in O(1).
Currently, there are only tests for the alerting functionality as well as some stats computation is tested. In order to test the alerting functionality, we simulate a server being down and being back up (using mocking functions).
.
├── README.md
├── images
├── main.py
├── requirements.txt
├── setup.py
├── stella
│   ├── __init__.py
│   ├── alert.py
│   ├── app.py
│   ├── config.py
│   ├── dashboard.py
│   ├── helpers.py
│   ├── stats.py
│   └── website.py
├── tests
│   └── unit
│       ├── test_stats.py
│       └── test_website.py
└── websites.conf
- Add more stats, such as the 95th or 99th percentile of response times, which would provide a better insight into the health of the website than the average.
- Better display the alert codes based on their signification for the website pages.
- Alerting configuration : the alert checking is hardcoded for the availability metric. Add the ability to specify several alert checks and types, for example through an alerting config file specifying for each metric, the website, threshold and timeframe to monitor.
- Ability to save the stats in memory so that if the program is stoped shortly to reload the website list, we do not loose the stats from the previous minutes/hours/etc. Alternatively, add the ability to add a website from the Dashboard or hot-reload the
websites.conffile.
- When parsing the
websites.confconf files, Errors are not handled : improve parsing (check integer and url integrity) to help the user identify when there is an error in the config file. - Website monitoring is done with one thread per website. Due to the python Global Interpreter Lock, they do not run concurrently, allowing potential bottlenecks for the program (for ex if we have many websites (more than 100), the interface may flicker when reloading).
- The
app.alert_historyis shared among all websites : replace the object sharing by using producer/consumer queue per website, whereby each websites produces alerts and the main thread consumes them to save in the main alert history. - Stats objects are built based on the assumption that stats will be updated every check_interval. If for some reason the stats are not updated (for exemple if the host machine freezes), the stats do not really represent the last time timeframe of data. Therefore, we need to add the notion of timestamp for each new data, and compute stats based on the timestamps. The data from the metrics queues will be poped, up to data whose timestamp is in the timeframe.
See the Github issue tracker


