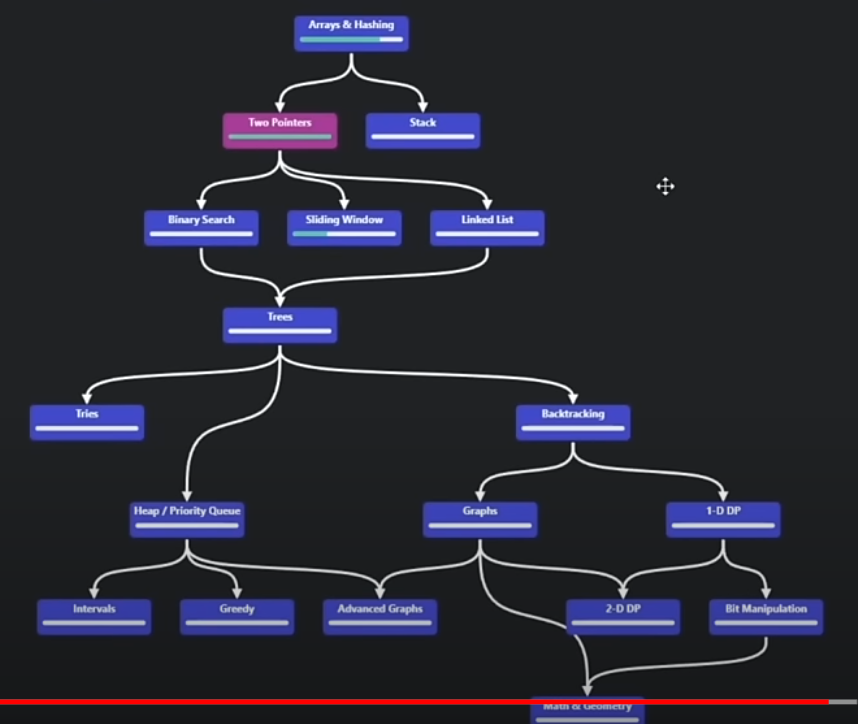
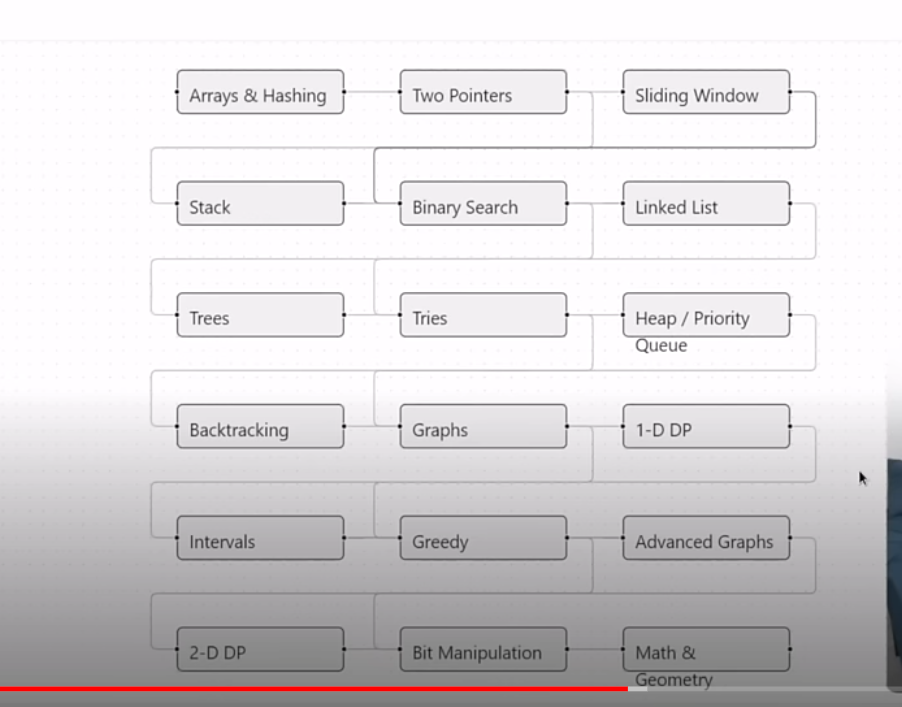
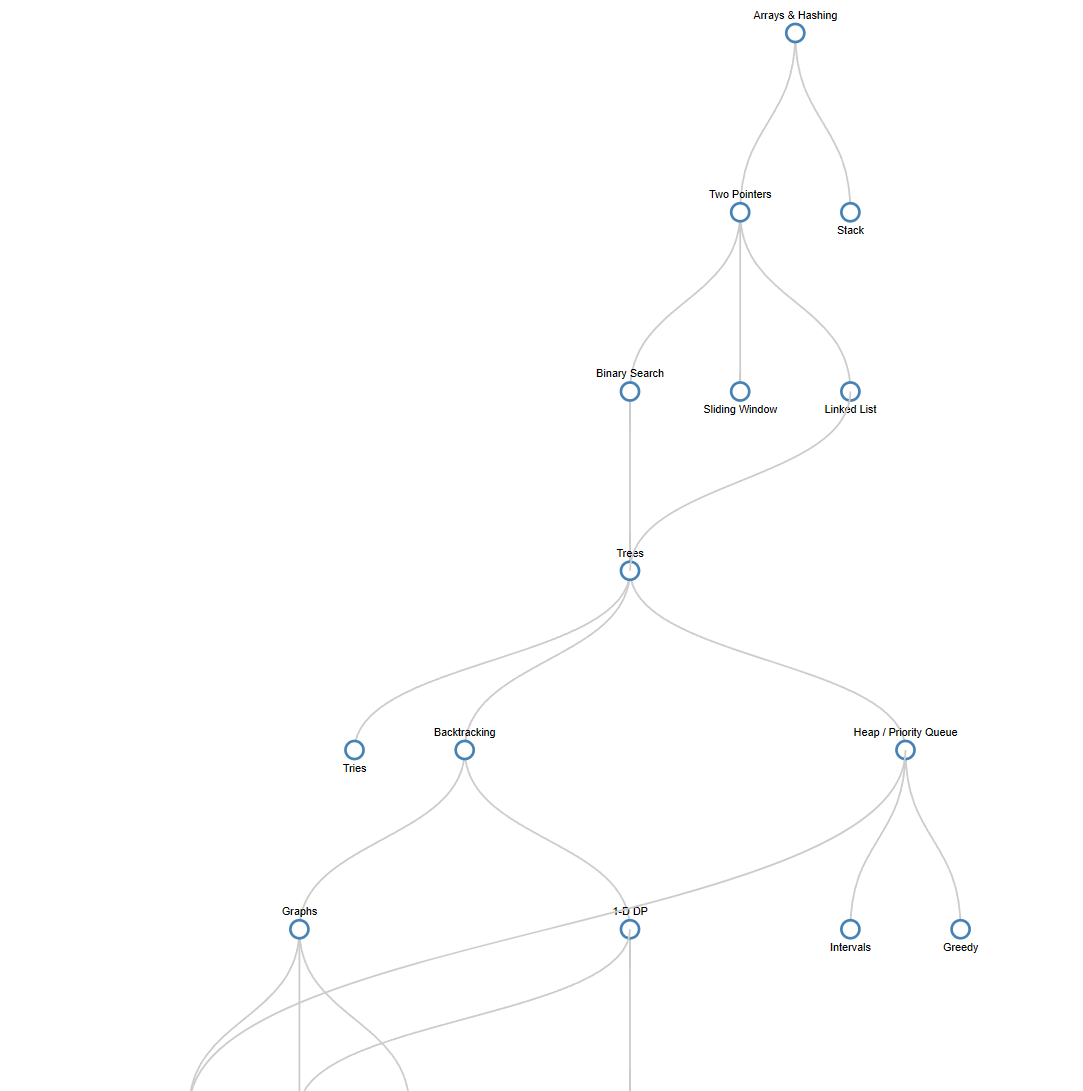
Watching Prime's video reacting to Neetcode's reaction to a post about Claude enabling 10x speed. At 24:30 they are showing an example of someone that tried to recreate part of NeetCode's site that shows a graph in what looks like SVG of what I assume are practice areas:
This is what the attempt was shown as:
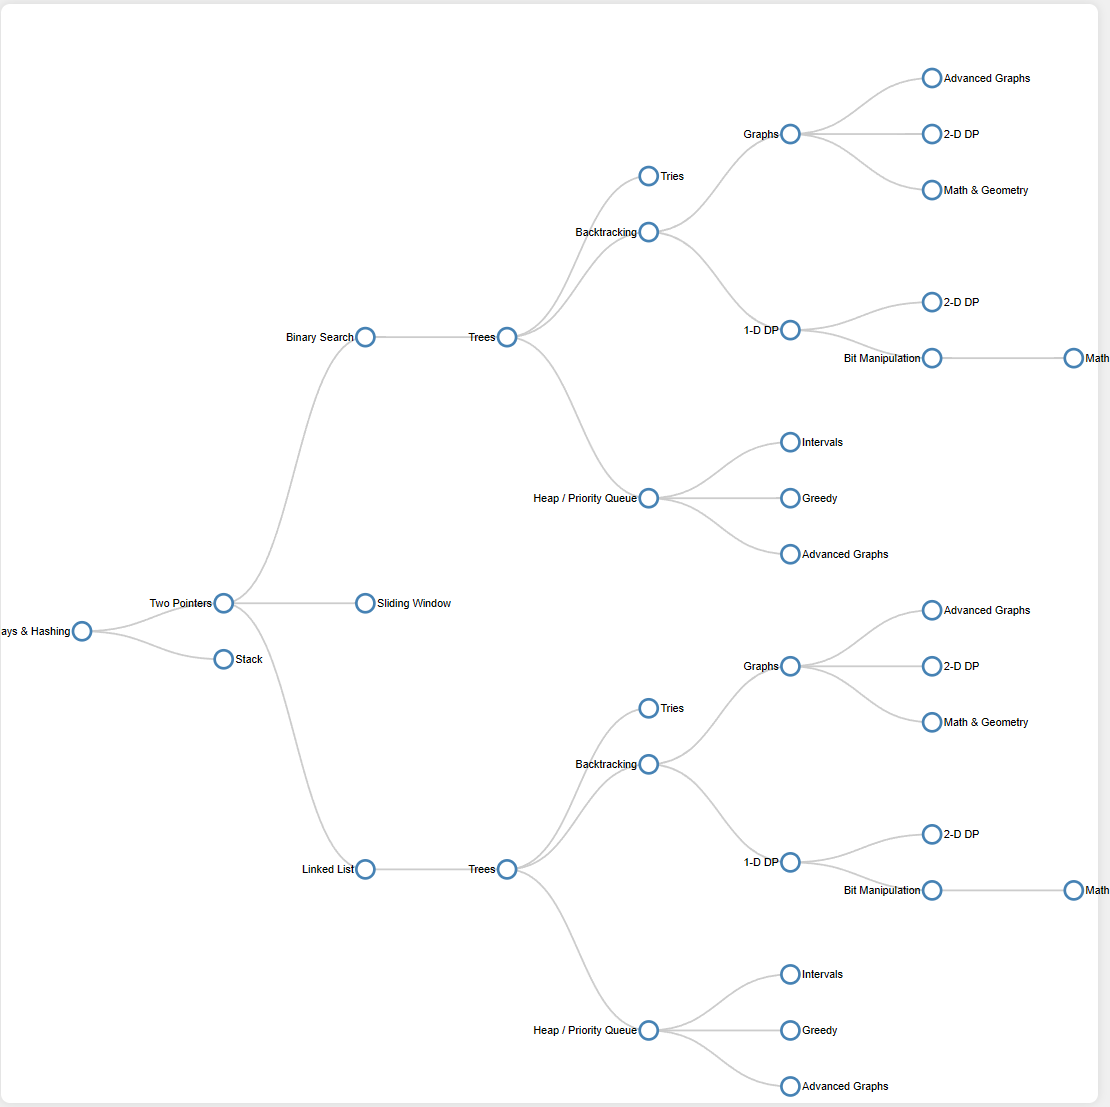
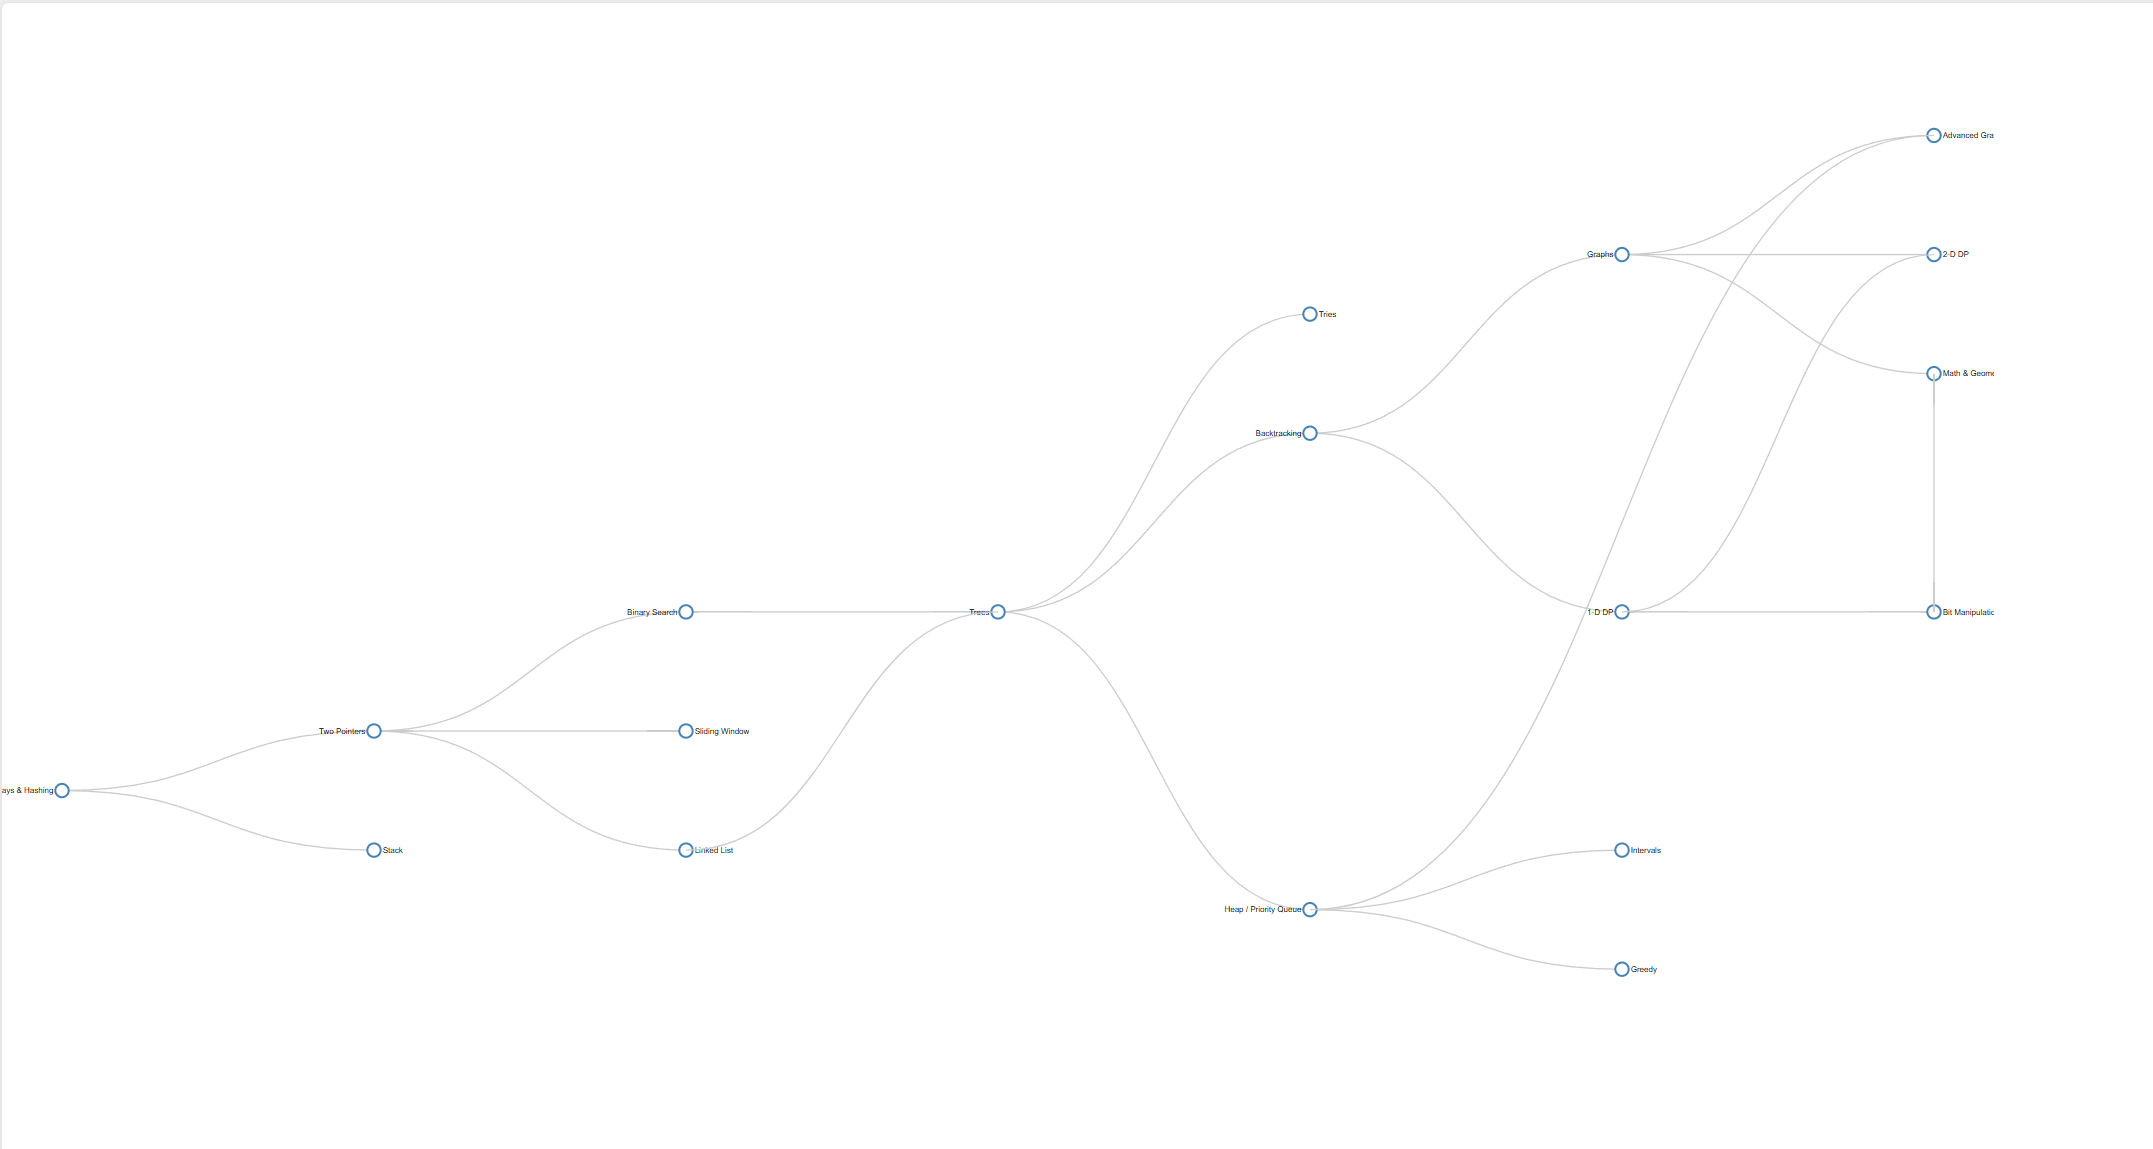
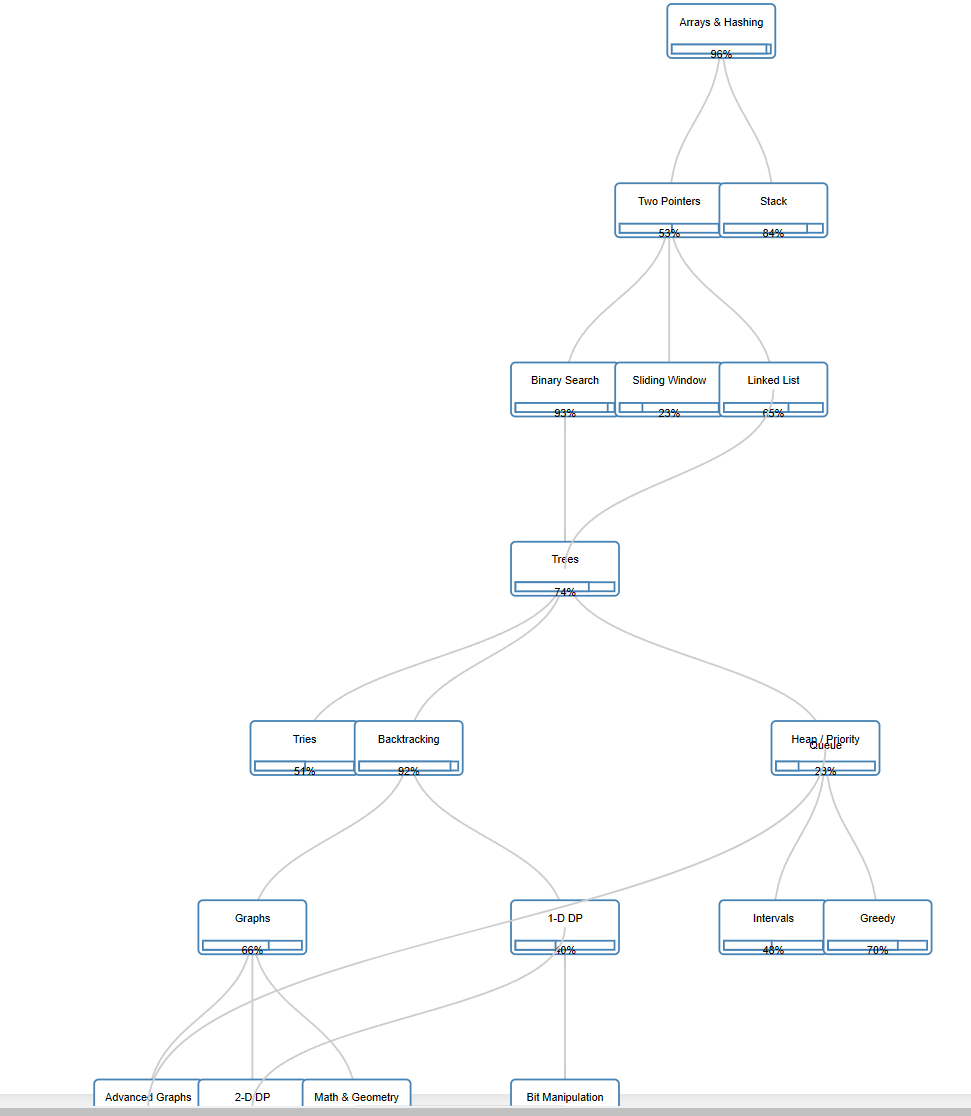
That does look a lot different and not as good. Things aren't linked the same for one thing. This is my attempt using Claude in 10 minutes:
This isn't perfect by any means, but it was fast. I spent 5 minutes markdown to represent the tree and 5 minutes giving Claude about 4 prompts.
The resulting code has the tree structure in JSON as input. It wouldn't take much time to change this to use results from a database call. There are some fixes that need to be made.
I'm no D3.js expert although I've used it a couple of times, mostly copying from examples and making it work with my data. It would probably take me a couple of hours to write this, relying on google searches to find how to use D3.js.
This is after 5 minutes of creating the markdown representation fo the graph shown in the video and ask Claude to convert it to JSON:
Create a representation of a tree in JSON given this markdown:
## Arrays & Hashing

* Two Pointers
* Stack
...
Full Markdown
## Arrays & Hashing

* Two Pointers
* Stack

## Two Pointers

* Binary Search
* Sliding Window
* Linked List

## Stack

## Binary Search

* Trees

## Linked List

* Trees

## Trees

* Tries
* Backtracking
* Heap / Priority Queue

## Tries

## Backtracking

* Graphs
* 1-D DP

## Heap/Priority Queue

* Intervals
* Greedy
* Advanced Graphs

## Graphs

* Advanced Graphs
* 2-D DP
* Math & Geometry

## 1-D DP

* 2-D DP
* Bit Manipulation

## Bit Manipulation

* Math & Geometry
Now I have a JSON representation and I've checked that it makes sense. It simply lists nodes, and nodes have a 'children' element with the names of the child nodes. Next I entered this prompt:
Given that JSON, create a web page showing the nodes and links
This is what the preview looks like:
It explains what it did, I notice it uses D3.js from a cdn.
I noticed that some nodes were duplicated, so I gave it this prompt:
Combine nodes with the same names into a single node
This is what the preview looks like:
Ok, lookin like the data is represented how I want, now to make it vertical:
make the graph vertical instead of horizontal
This is what the preview looks like:
Now to style it better...
Change the nodes to boxes that also contain progress bars
This is what the preview looks like:
This is what I had after 10 minutes. 1/2 the time was creating markdown with the data I wanted to use. There may be a d3 expert out there that could write exactly the code to create this graph in 5 minutes, but I doubt it. The whole time would be typing as fast as I've ever typed before and knowing exactly what you want to type ahead of time.
