observe-argo-rollout
Demo for Automating and Monitoring Kubernetes Rollouts with Argo and Prometheus
Performing Demo
The demo can be found on Katacoda.
Alternatively, you can follow the instructios below.
-
Deploy Kubernetes (tested with 1.18)
-
Install argo rollout kubectl plugin
curl -LO https://github.com/argoproj/argo-rollouts/releases/latest/download/kubectl-argo-rollouts-linux-amd64
chmod +x ./kubectl-argo-rollouts-linux-amd64
sudo mv ./kubectl-argo-rollouts-linux-amd64 /usr/local/bin/kubectl-argo-rollouts
- Install bat:
curl -LO https://github.com/sharkdp/bat/releases/download/v0.18.0/bat-v0.18.0-x86_64-unknown-linux-gnu.tar.gz
tar -xzf bat-v0.18.0-x86_64-unknown-linux-gnu.tar.gz
chmod +x ./bat-v0.18.0-x86_64-unknown-linux-gnu/bat
sudo mv ./bat-v0.18.0-x86_64-unknown-linux-gnu/bat /usr/local/bin/bat
- Run bash ./demo.sh
- Run commands one by one or the one you want using keyboard keys:
enter: execute command,enteragain to reveal another command.q: quitp: previous commandn: next commandb: start from beginningn: start from end
The structure of the demo can be viewed here.
Grafana Dashboard
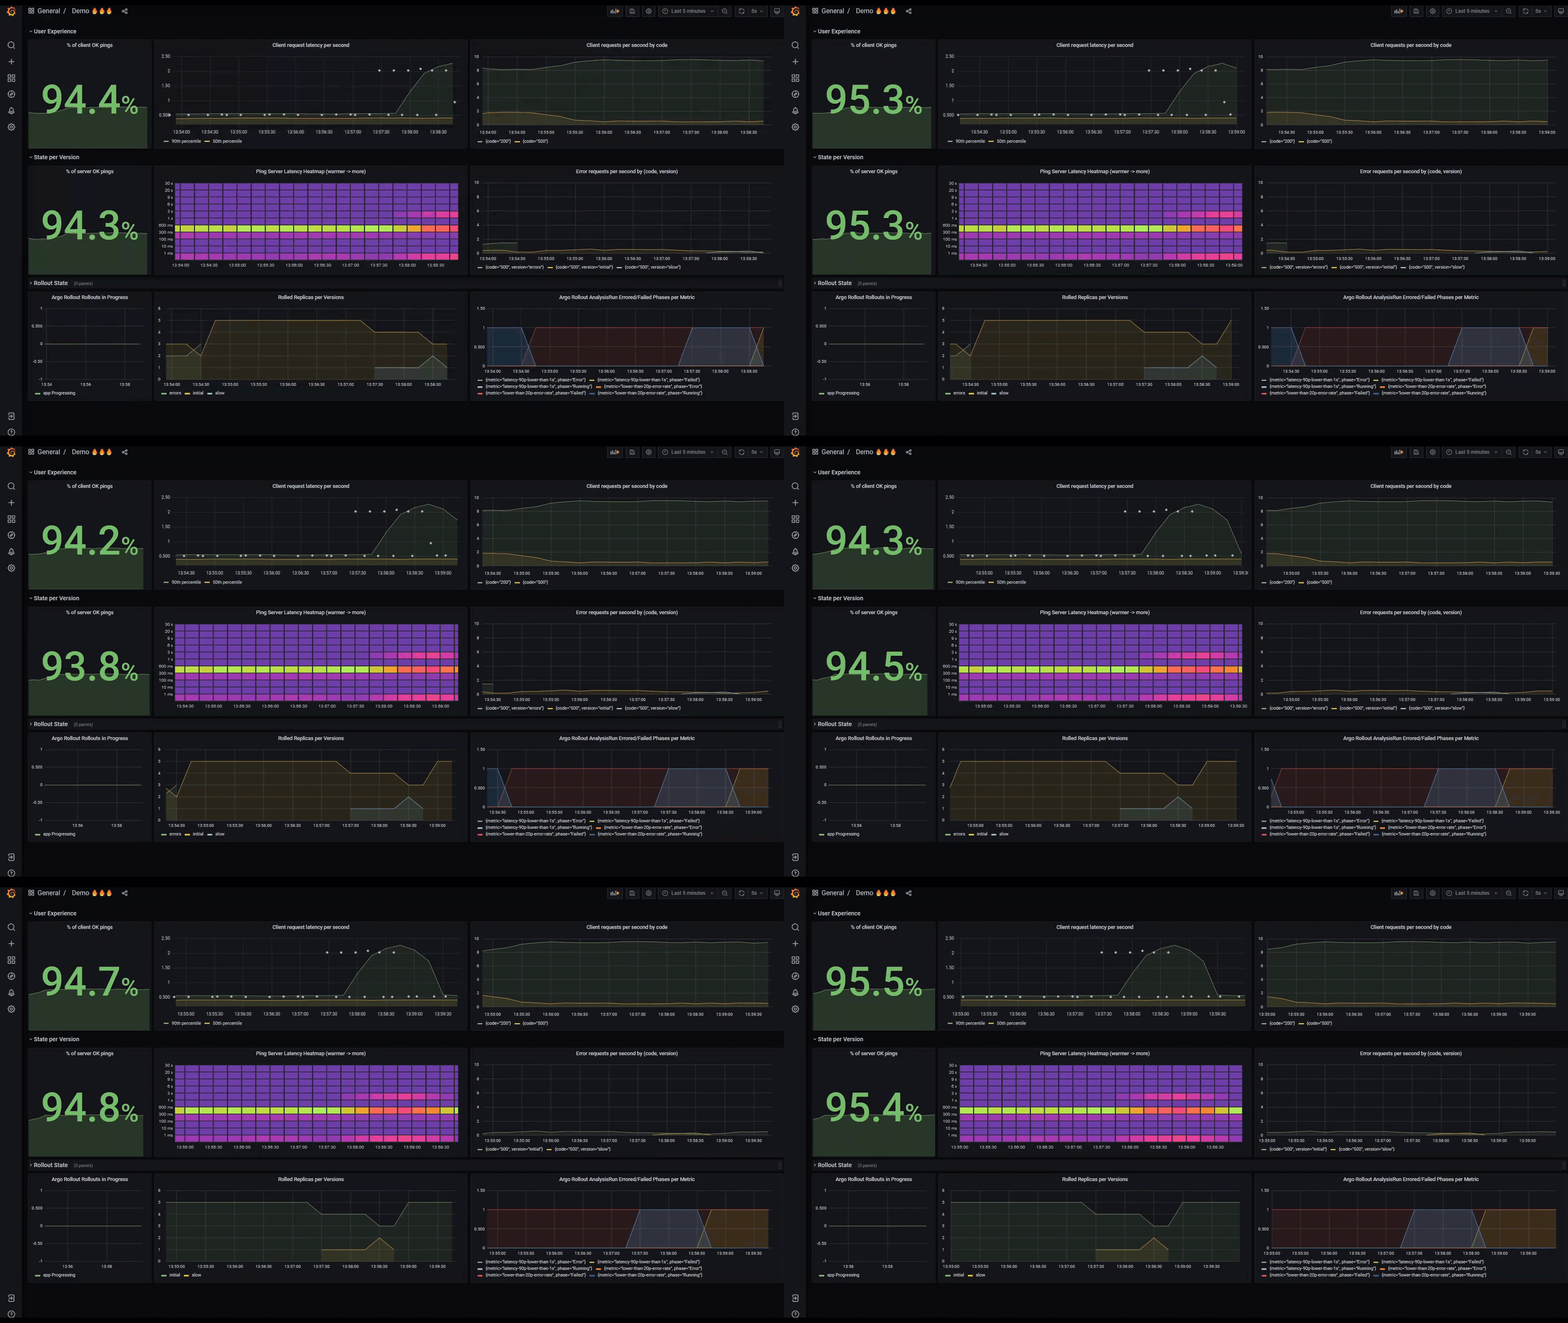
Once the first Argo rollout is deployed, you can view the metrics of the client and ping-pong app in the Grafana Dashboard. Katacoda provides you with a link to Prometheus and Grafana. Simply navigate to Dashboards < Manage < Demo and make sure that the pinger is deployed and running to see metrics.
