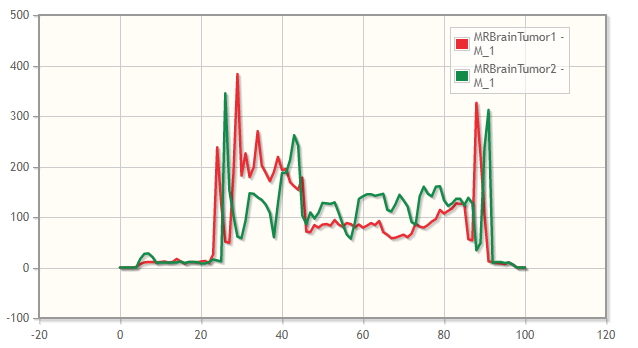
This repository consists of Line intensity profile extension build for slicer software as a requirement to fulfill Medical Image Processing module (University of Moratuwa). The line intensity profile provides the plot of intensity levels of pixels in the drawn line, which can be used to compare anatomical structures and noise levels of multiple images. The following slicer extension is capable of plotting line intensity profiles of a drawn line in 2 given 3D images and visualize the results.
A sample of the Line Intensity Profile extension in 3D Slicer:

Line intensity profiles of two 3D MRI Brain images was plotted in axial, sagittal and coronal planes. The results are as follows:
Axial:

Sagittal:

Coronal:

-
Python
-
3D Slicer Software
3D Slicer is a free, open source and multi-platform software package widely used for medical, biomedical, and related imaging research. Slicer is created for the purpose of subject specific image analysis and visualization. The software can be downloaded from slicer.org.
- Download and extract the files from this repository.
- Install `DeveloperToolsForExtensions' from extension manager.
- Restart 3D Slicer.
- Open the Developer tools for extensions. (Modules → Developer tools → Developer tools for extension)
- Load the LineIntensityProfile.py using Load Module.
- Open Line Intensity Profile.
-
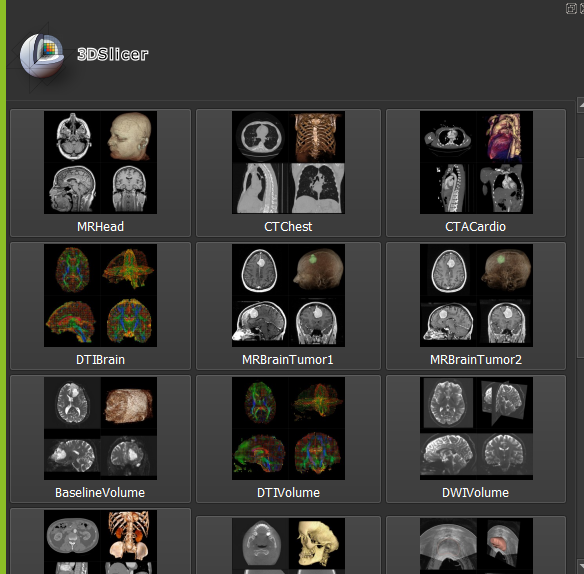
Load Sample Data
The Sample data module can be found using Module finder in 3D Slicer. (Own data can also be loaded for testing)
Module Finder → Sample data → Select any two built-in data
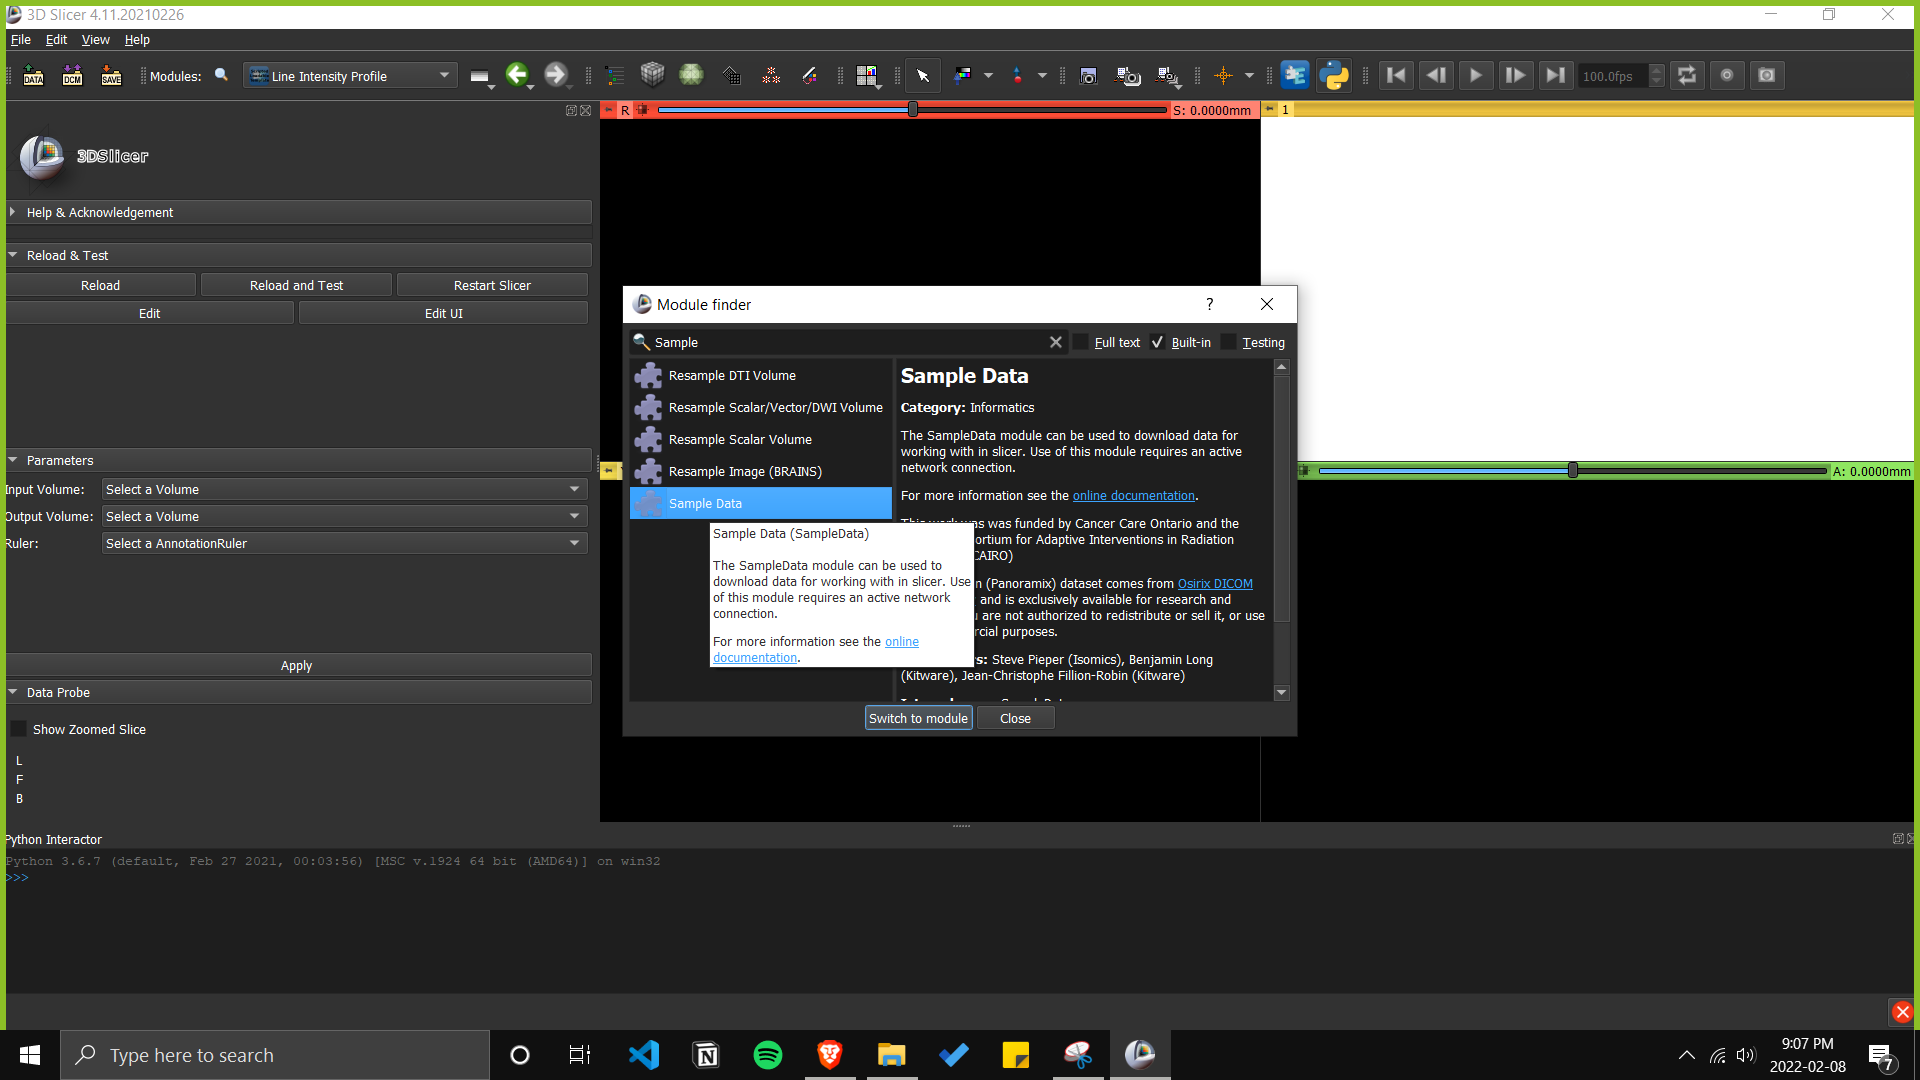
Any sample images provided by slicer can be selected for line intensity analysis.
-
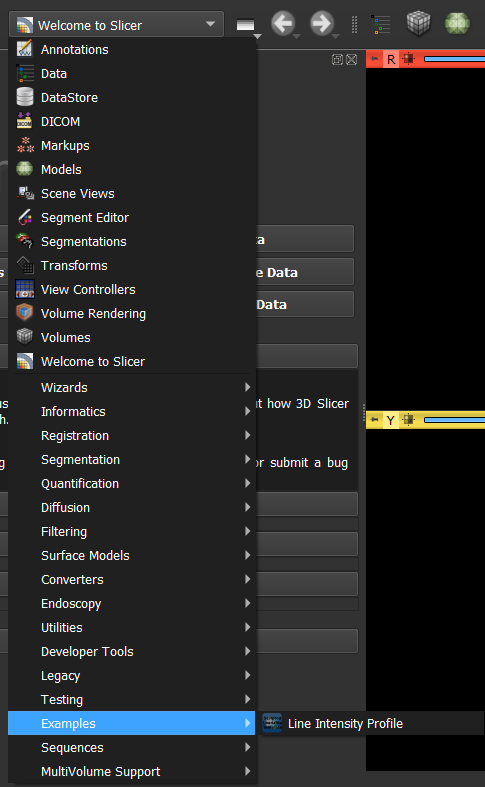
Load Line Intensity Profile Extension
The Line Intensity Profile can be loaded as follows:
Modules → Examples → Line Intensity Profile


The User interface of the Line Intensity Profile widget as follows:

-
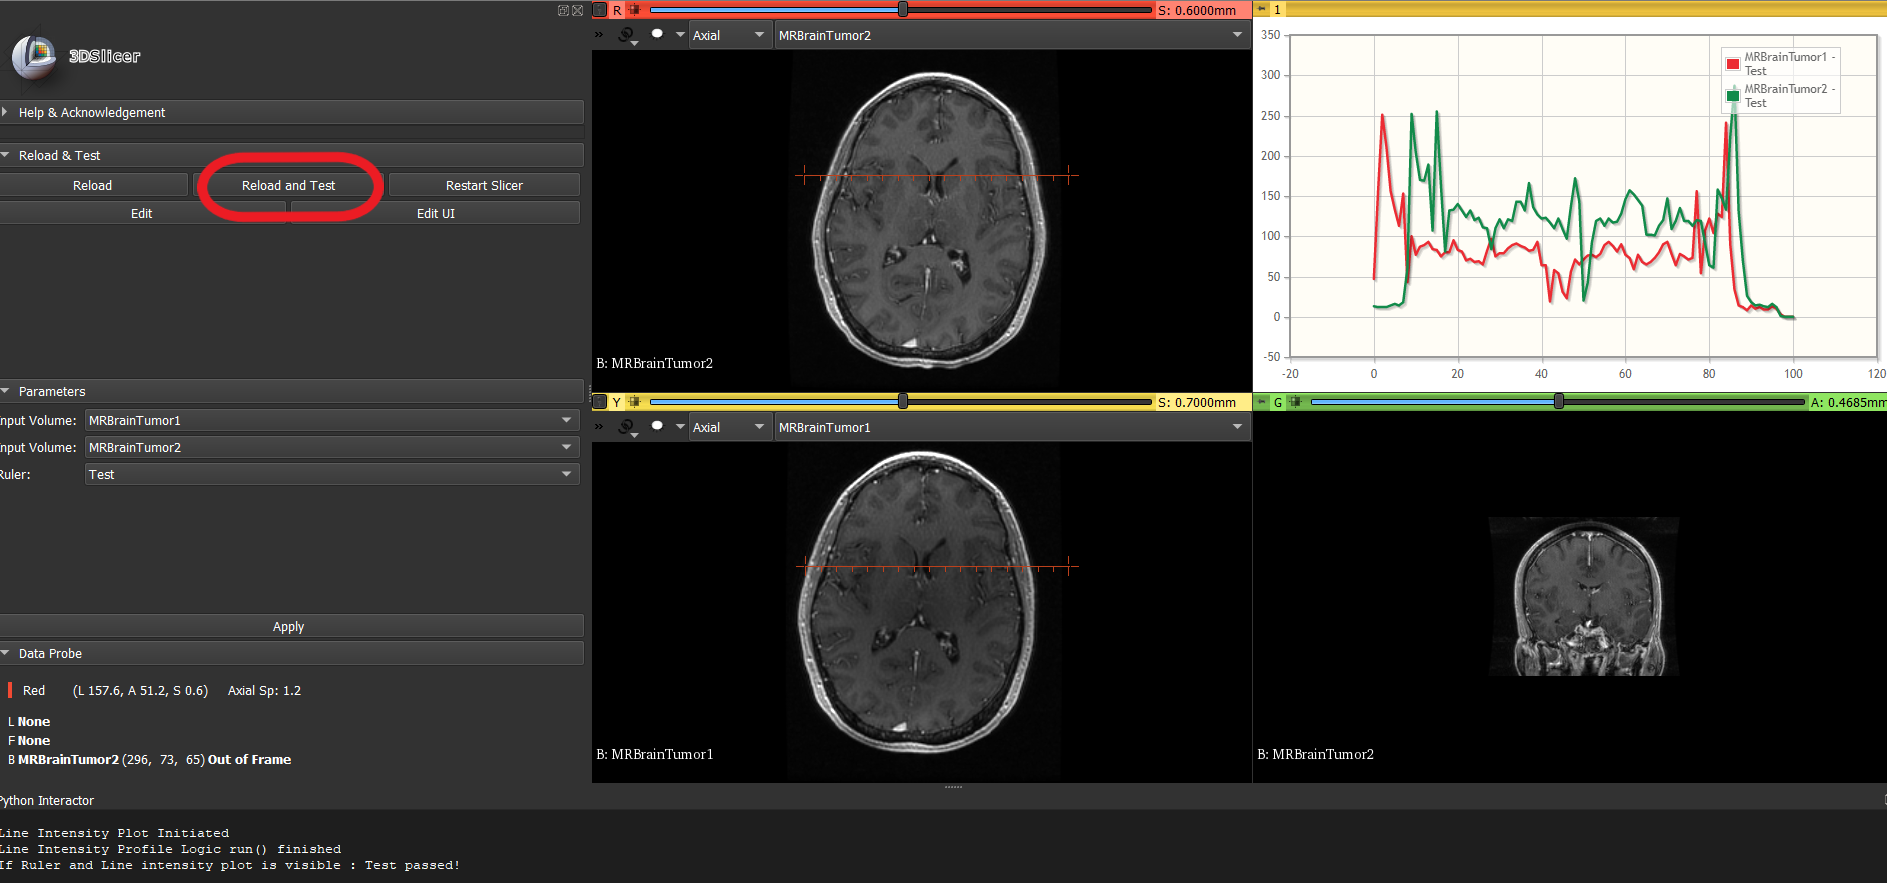
Reload and Test
Click “Reload and Test” button in the widget to load and test the functionality of line intensity profile. Here, the functionality is correct, if two samples volumes are loaded and a ruler is placed on a given predefined position. The outcome should be as given below:
-
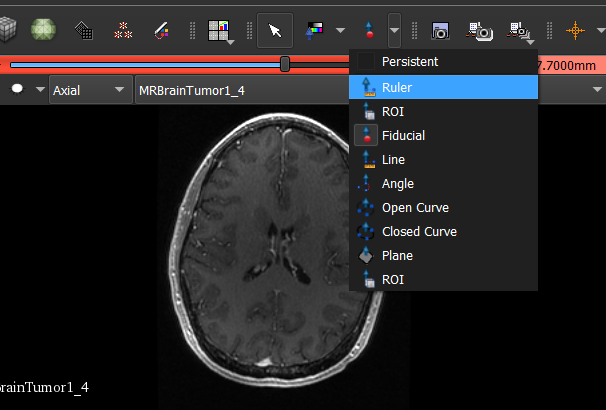
Select the correct volume nodes and then the ruler can be selected from the toolbar
-
Acquire Line Intensity Profiles
Place the ruler on any one of the loaded image and draw a line across the Region of Interest as shown before to acquire Line Intensity Profiles. (Example given below)
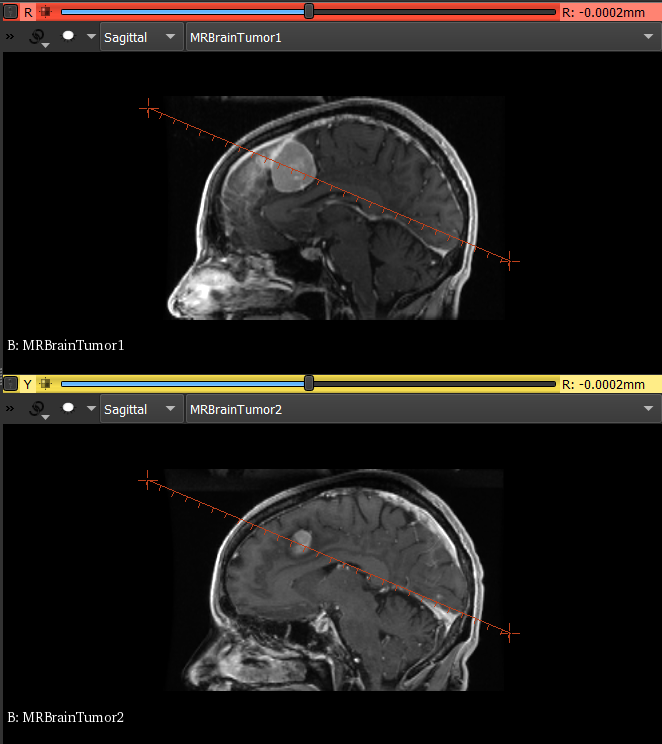
The Corresponding Line Intensity Profile:
Hope you enjoyed it. Happy exploring!
I would like to express my gratitude towards Dr. Nuwan Dayananda, Dr. Ranga Rodrigo and Mr. Achintha Iroshan, for introducing us to 3D Slicer software and enabling us to develop line intensity profile extension using slicer.
Developing and contributing extensions for 3D Slicer
by: Andrey Fedorov, Jean-Christophe Fillion-Robin and Steve Pieper.
Brigham and Women’s Hospital/Harvard Medical School, Kitware Inc., Isomics Inc.


