Analysis of the absent data in order to select the subset of features shared by the most patients
This tool allows to select the subset of features containing the less missing values. Additional functionnalities are available in order to merge features (in medical data, it is usually the case that some features can be obtained from other, so during the analysis it can be interesting to merge such feature)
Executed with python2 and 3 with pandas and graphviz libraries for visualization
Contains the code of an eclat algorithm and the functions necessary for displaying the graph.
A small example is used on a generated dataset.
It will produce multiple images given the chosen option:
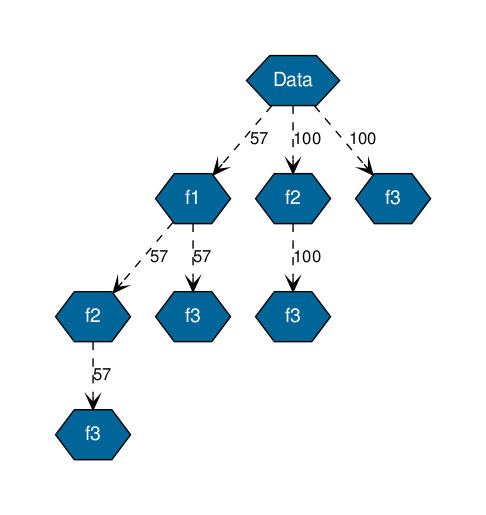
A text output of the previous tree is :
 + Node : Data - Count : 100
|  + Node : f1 - Count : 57
| |  + Node : f2 - Count : 57
| | |  + Node : f3 - Count : 57
| |  + Node : f3 - Count : 57
|  + Node : f2 - Count : 100
| |  + Node : f3 - Count : 100
|  + Node : f3 - Count : 100
It is obtained when we focus only on 3 particular features, each node represent a features (or the name indicated as a key in the dictionary features of the function eclat). And each edge has a number which represent the number of datapoints which has the feature indicated in the father node.
For instance, the branch on the left, shows that 57 datapoints have the features f1 not nan, in this group all of them has f2 and f3.
Such a tree allows to choose which subset of features or patients can be interesting to our analysis.
