Grafana datasource for Factry Historian.
Empower anyone to analyze industrial process and event data with Grafana. The Grafana Data Source for Factry Historian makes it easy for users to browse assets, trend time-series and event data such as batches or shifts – with zero technical skills required.
- Browsing your asset structure (e.g. ISA88/ISA95 equipment model)
- Trending time-series data, while auto-configuring units of measurement
- Overlaying of events (e.g. golden batch analysis)
- Ad-hoc overlaying of time-series data on top of events
- Query historical data using the asset tree defined in Factry Historian
- Query historical data using measurements from Factry Historian
- Autoload Units of Measurement, Y-axis scaling and HI/LO boundaries
- Query Events from Factry Historian (e.g. batches, CIP cycles)
- Annotate trends with Event data from Factry Historian
- Use assets, measurements and events from Factry Historian as variables to build dynamic dashboards
A full step-by-step guide can be found in the 'Installing Factry Historian Datasource' Tutorial.
Install using the grafana-cli or by cloning the repository directly into the Grafana plugins directory.
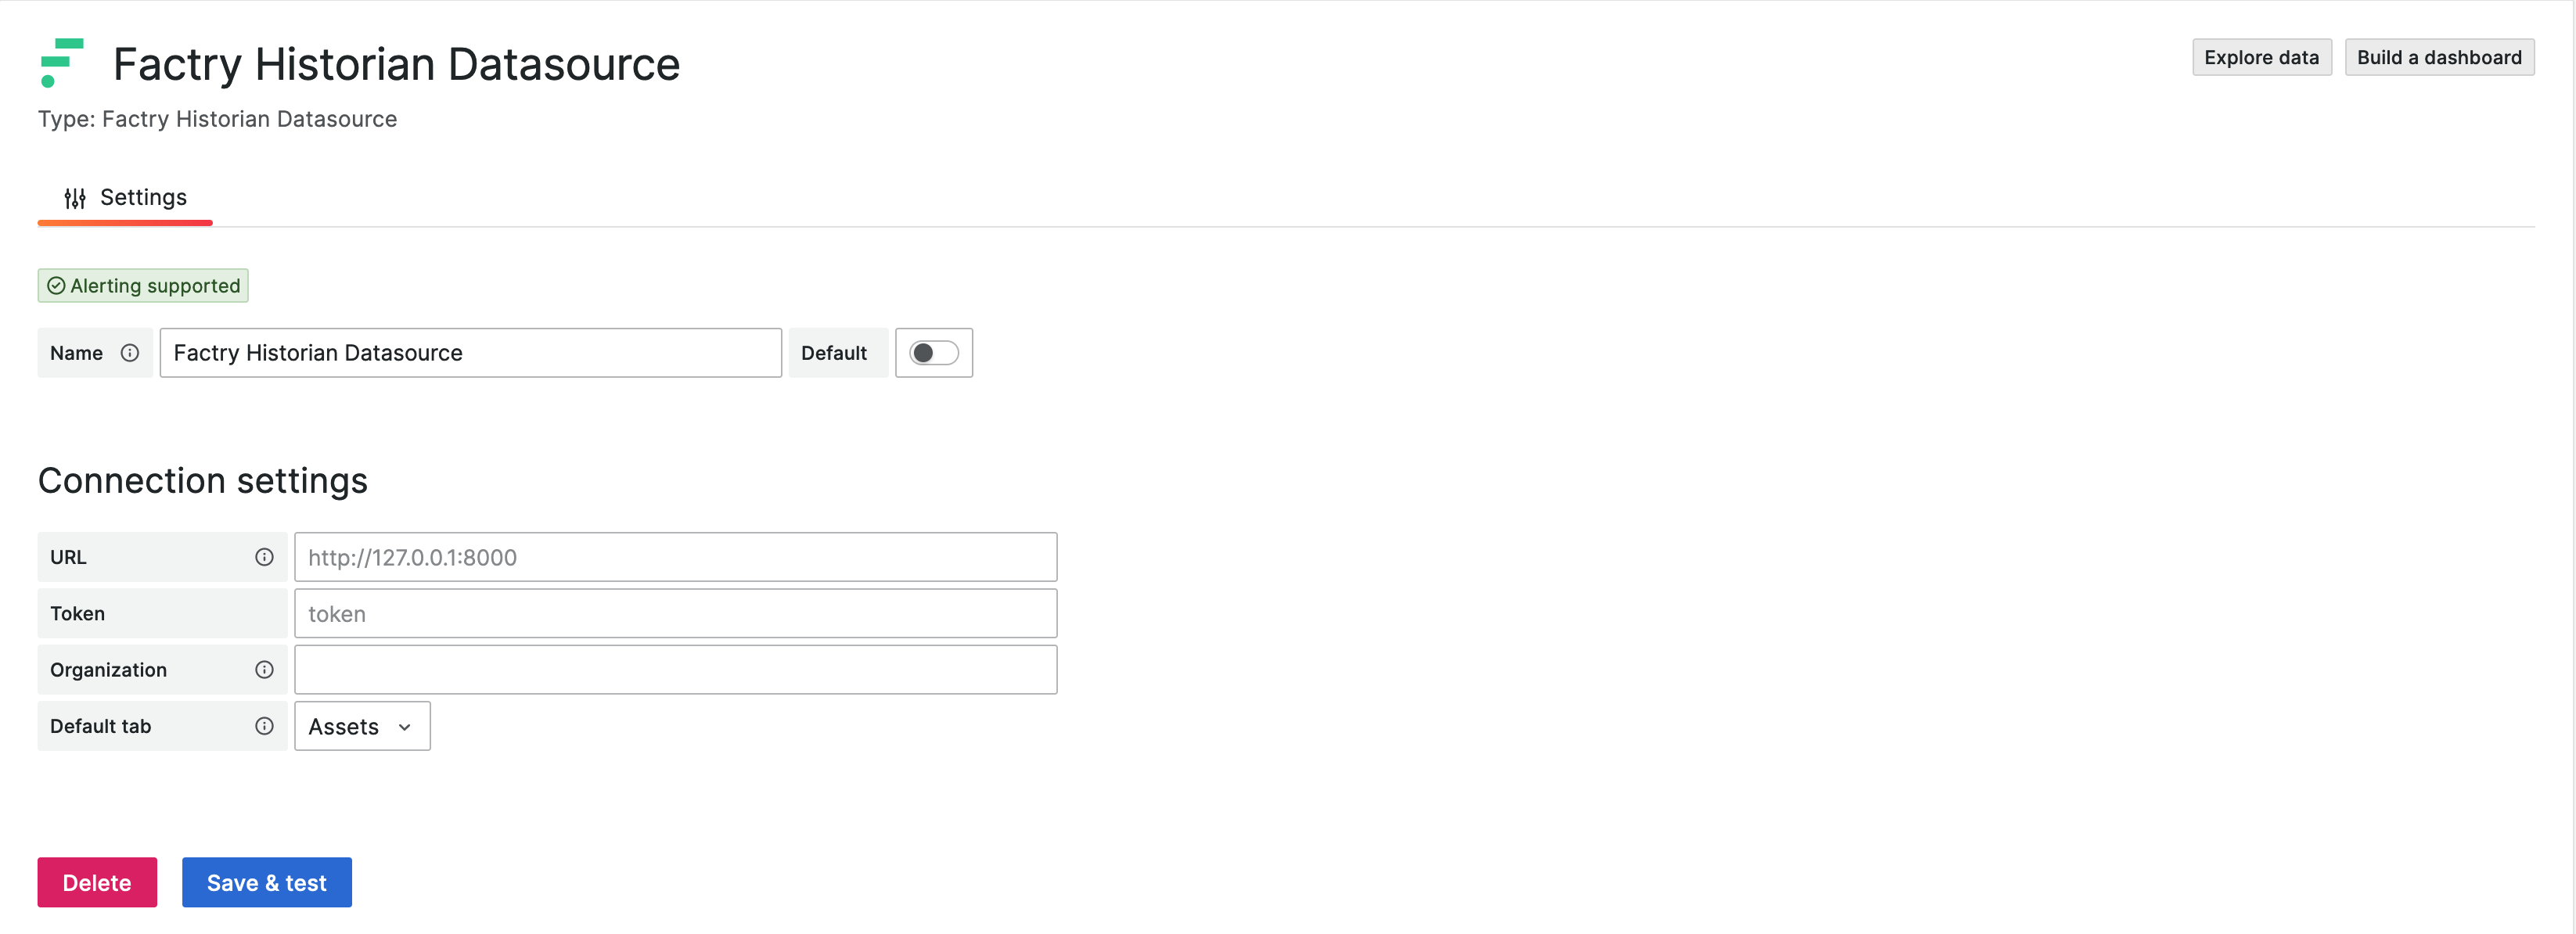
grafana-cli plugins install factry-historian-datasourceCreate a new instance of the data source from the Grafana Data Sources administration page. And configure the necessary settings.
- URL: The URL of the Factry Historian API.
- Token: The API token to authenticate with the Factry Historian API.
- Organization: The UUID of the organization to query data from.
- Default tab: The default tab to show when opening the query editor.
Full documentation can be found at the Factry documentation site: https://docs.factry.cloud/docs/grafana-datasource
A data source backend plugin consists of both frontend and backend components, frontend components reside in /src and backend components reside in /pkg.
After starting the application in either debug or normal mode, navigate to http://localhost:3001 to view the plugin in Grafana. The datasource, along with some dashboards, will be automatically provisioned.
To run the plugin in debug mode, with filewatchers and hot-reloading enabled:
make clean  # optional
make run_debugTo run the plugin in normal mode, without filewatchers and hot-reloading:
make clean  # optional
make build_all
make run_server