| title | output | ||||
|---|---|---|---|---|---|
Scripts for exploring regulatory potential of predefined regions |
|
Here is a set of scripts for the for exploring regulatory potential of predefined regions.
usage: makeWindows.py [-h] -A ANNOTATION_FILE [-HWP WINDOW_PROMOTER] [-HWE WINDOW_ENHANCER] [-BN BIN_NUMBERS] [-C CUT_LENGTH] [-L MIN_LENGTH] -O OUTPUT_TAG

optional arguments:
  -h, --help            show this help message and exit
  -A ANNOTATION_FILE, --annotation_file ANNOTATION_FILE
                        Gene annotation file.
  -HWP WINDOW_PROMOTER, --window_promoter WINDOW_PROMOTER
                        Half window size for promoters [100].
  -HWE WINDOW_ENHANCER, --window_enhancer WINDOW_ENHANCER
                        Half window size for enhancers [10000].
  -BN BIN_NUMBERS, --bin_numbers BIN_NUMBERS
                        Number of bins for gene bodies [20].
  -C CUT_LENGTH, --cut_length CUT_LENGTH
                        Numober of bases to cut from gene bodies [1000].
  -L MIN_LENGTH, --min_length MIN_LENGTH
                        Minimal length of gene body [1000].
  -O OUTPUT_TAG, --output_tag OUTPUT_TAG
                        Prefix for output files.
The ANNOTATION_FILE is provided for human genome hg19 in the out folder. To run the script with default setting:
python makeWindows.py -A GeneAnnotation_Hg19.tsv -O hg19
The resulting file 'hg19_windows.bed' contains genomic intervals regarding gene structures for each gene:
chr1    68990   69190   ENSG00000186092_OR4F5_P_0
chr1    68790   68990   ENSG00000186092_OR4F5_PU_1
chr1    68590   68790   ENSG00000186092_OR4F5_PU_2
chr1    68390   68590   ENSG00000186092_OR4F5_PU_3
chr1    68190   68390   ENSG00000186092_OR4F5_PU_4
chr1    67990   68190   ENSG00000186092_OR4F5_PU_5
chr1    67790   67990   ENSG00000186092_OR4F5_PU_6
chr1    67590   67790   ENSG00000186092_OR4F5_PU_7
chr1    67390   67590   ENSG00000186092_OR4F5_PU_8
chr1    67190   67390   ENSG00000186092_OR4F5_PU_9
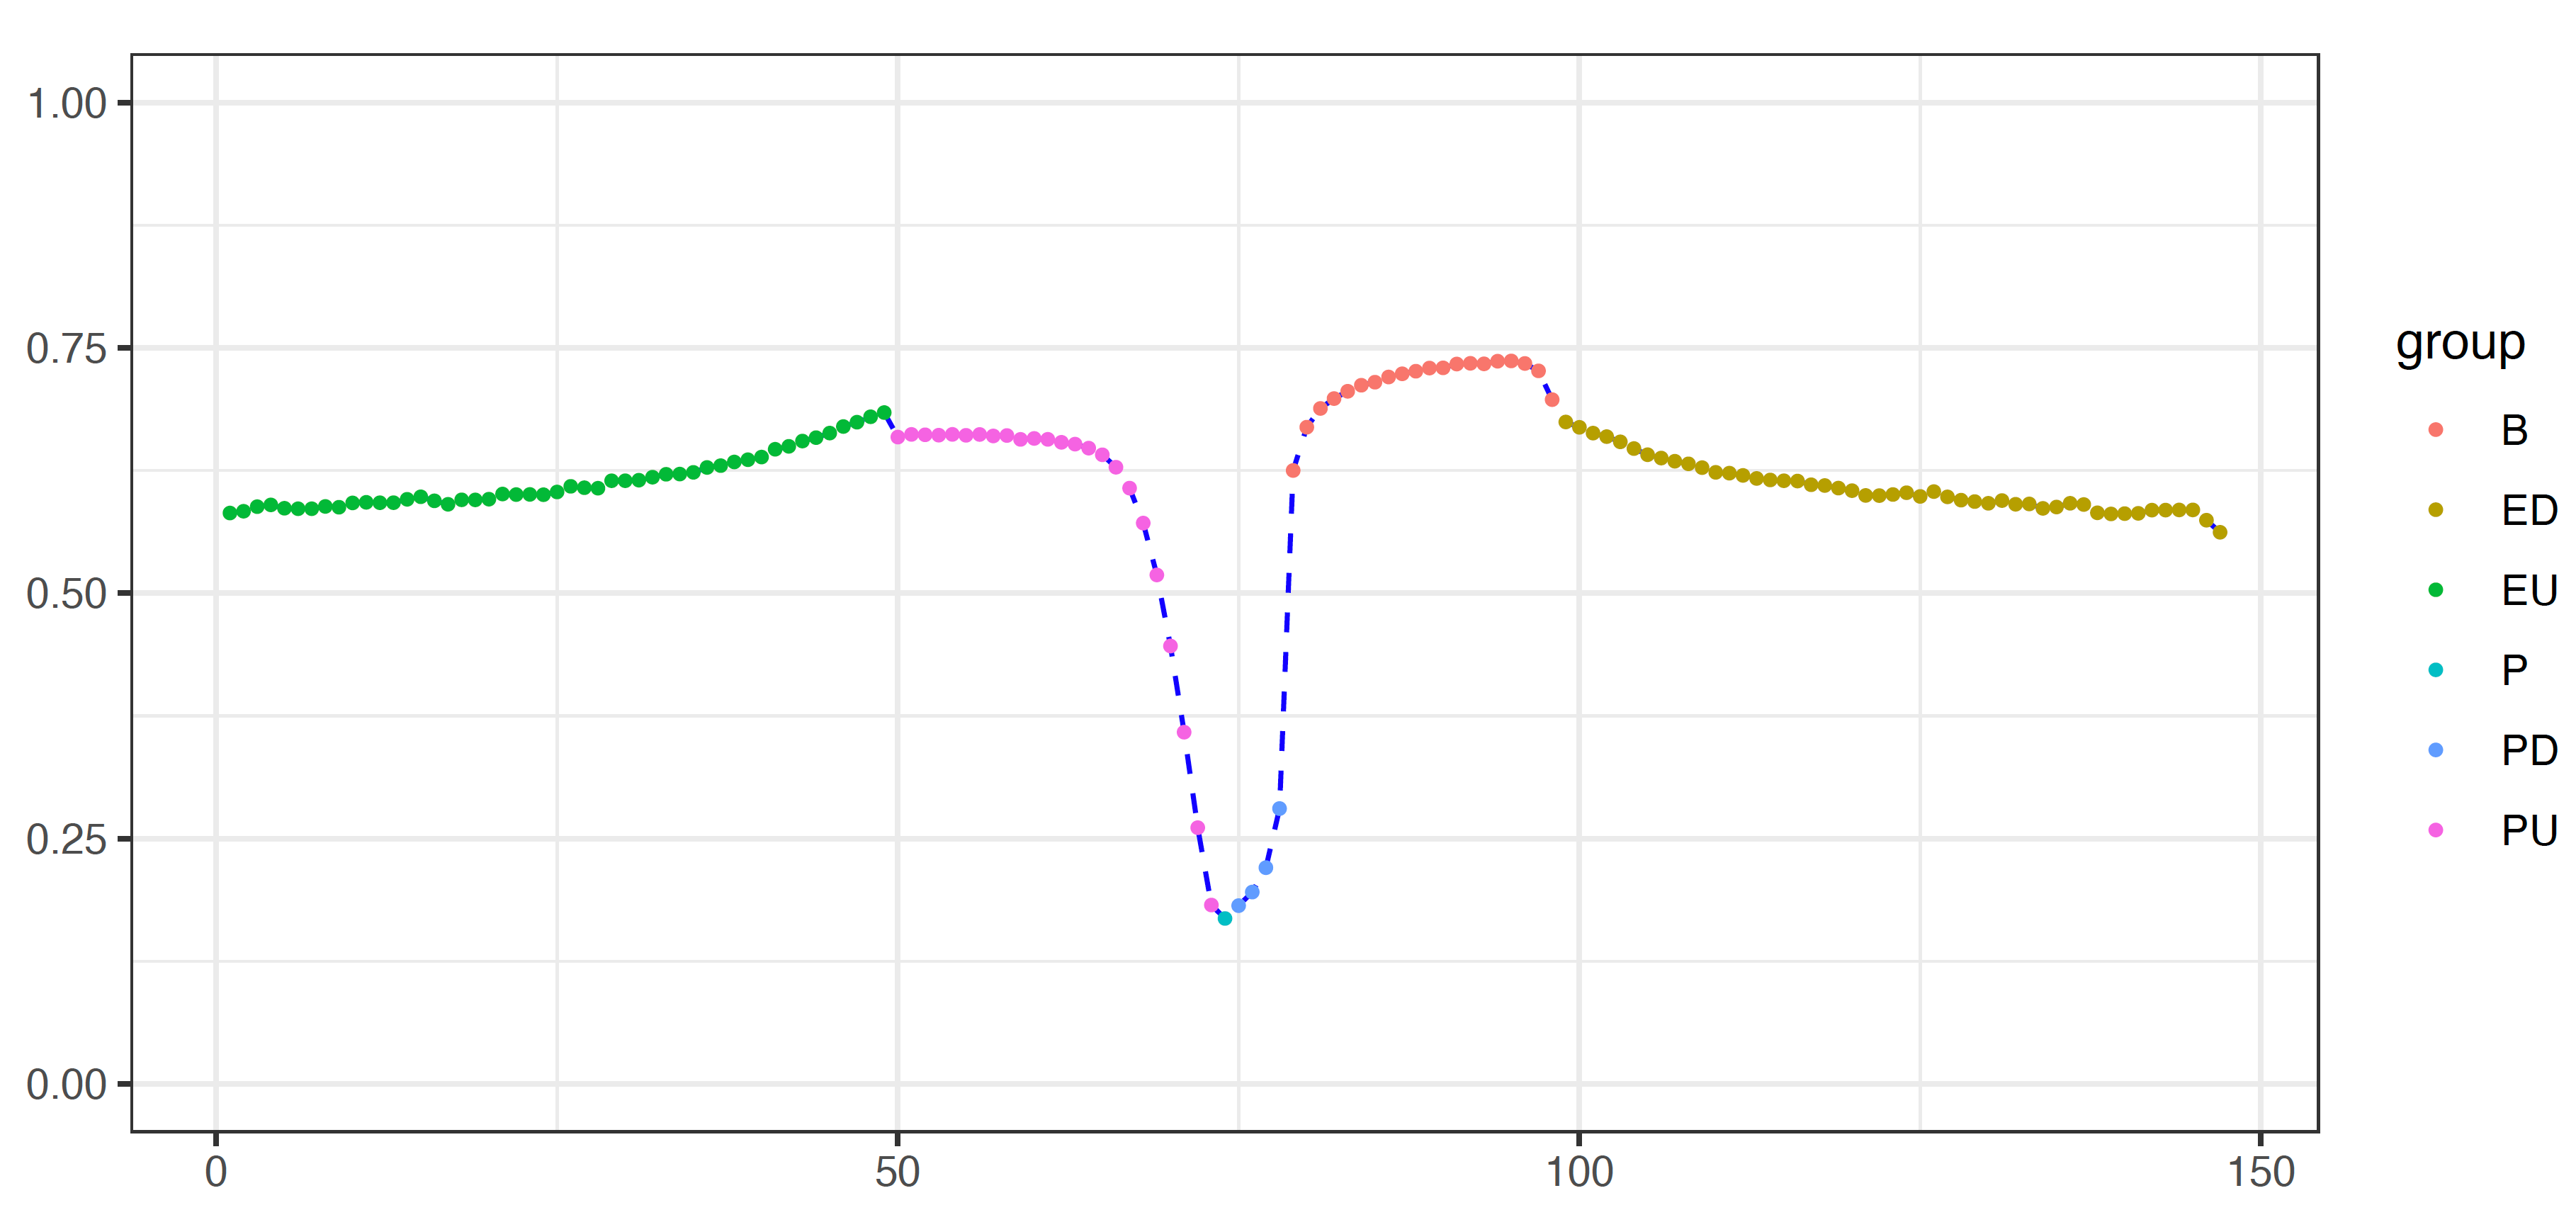
In the 4th column, the unique ID for each region was designed to contain ENSEMBL gene ID, gene symbol, feature and window number for each feature. There are 4 types of features, including distal upstream regions (EU), promoters (P, PU, PD), gene bodies (B) and distal downstream regions (ED).
This can be done using the multiBigwigSummary function in deepTools. Genome-wide signal such as DNA methylation should be stored in a bigwig file.
/sibcb/program/install/deeptools-3.2.1/bin/multiBigwigSummary BED-file \
  --BED hg19_windows.bed \
  -b esophagus_T_MM.bw \
  --outRawCounts esophagus_T_score.tsv \
  -o tmp.npz
The resulting file should cover all regions in window file but reordered.
#'chr'  'start' 'end'   'esophagus_T_MM.bw'
chr1    14090   34090   0.5711935773835404
chr1    34090   54090   0.726074748171194
chr1    64190   64390   nan
chr1    64390   64590   0.375
chr1    64590   64790   0.4534412920475006
chr1    64790   64990   0.35458168387413025
chr1    64990   65190   0.9166666865348816
chr1    65190   65390   nan
chr1    65390   65590   nan
Rscript getProfile.R -h
Options:
        --windowFile=WINDOWFILE
                Window file returned by makeWindows.

        --signalFile=SIGNALFILE
                Signal file generated by deepTools on regions defined in window_file.

        --BED=BED
                BED file of interest.

        --method=METHOD
                Summary method [mean, median].

        --outTag=OUTTAG
                Prefix for output files.

        -h, --help
                Show this help message and exit
The signal file was generated in the previous step.
Rscript getProfile.R --windowFile hg19_windows.bed \
  --signalFile esophagus_T_score.tsv \
  --outTag esophagus_T
Rscript plotProfile.R -h
Options:
        --profile_file=PROFILE_FILE
                One profile file to be plotted.

        --sample_sheet=SAMPLE_SHEET
                A samplesheet to describe multiple profile files.

        --outTag=OUTTAG
                Prefix for output files.

        -h, --help
                Show this help message and exi
To plot one profile:
Rscript plotProfile.R --profile_file esophagus_T_profile.tsv --outTag esophagus_T
It was known that gene expression are negatively correlated with DNA methylation in promoter regions. However, the relationship is less explored in other features of the genome nor in the presence of other regulatory regions such as open chromatin regions.
singleSampleRA.R -h
Options:
        --windowFile=WINDOWFILE
                Window file returned by makeWindows.

        --signalFile=SIGNALFILE
                Signal file generated by deepTools on regions defined in window_file.

        --BED=BED
                BED file of interest.

        --expression_file=EXPRESSION_FILE
                Gene expression profile [1st: gene_id/gene_name; 2nd: log transformed value].

        --min_N=MIN_N
                Minimal number of genes to calculate summary scores [20].

        --min_methylation=MIN_METHYLATION
                Minimal methylation for further analysis [0].

        --max_methylation=MAX_METHYLATION
                Maximal methylation for further analysis [1].

        --method=METHOD
                Summary method [Pearson, Spearman, median, mean].

        --outTag=OUTTAG
                Prefix for output files.

        -h, --help
                Show this help message and exit
The method parameter controls how summary is performed. By setting this parameter as Pearson or Spearman, correlation will be calculated between DNA methylation and gene expression for each window. Alternatively, setting this parameter to median or mean will ignore DNA methylation and reported median or mean DNA methylation in each window.
Rscript singleSampleRA.R \
  --windowFile hg19_windows.bed \
  --signalFile esophagus_T_score.tsv \
  --BED esophagus_T_MHB.txt \
  --min_methylation 0 \
  --max_methylation 1  \
  --method Pearson  \
  --expression_file GSM4505886_T1.txt \
  --outTag esophagus_T_Pearson
The results look like:
Num_All Num_Feature     Score_All       Score_Feature
EU_2    8615    892     0.273584436154975       0.183173404046737
EU_1    10960   1253    0.313645114677926       0.255364543245263
PU_23   14123   84      0.199370638649568       0.0712089652212049
PU_22   14109   86      0.195235920725899       0.0713547901031287
PU_21   14116   88      0.2106527569829 -0.106417868517083
PU_20   14181   72      0.204725214923501       -0.0751451609553298
PU_16   14130   85      0.203080136300442       0.0249686692827358
PU_11   14334   86      0.181644123785359       0.282236463340651
PU_10   14520   108     0.173973677565651       0.221791973016975
