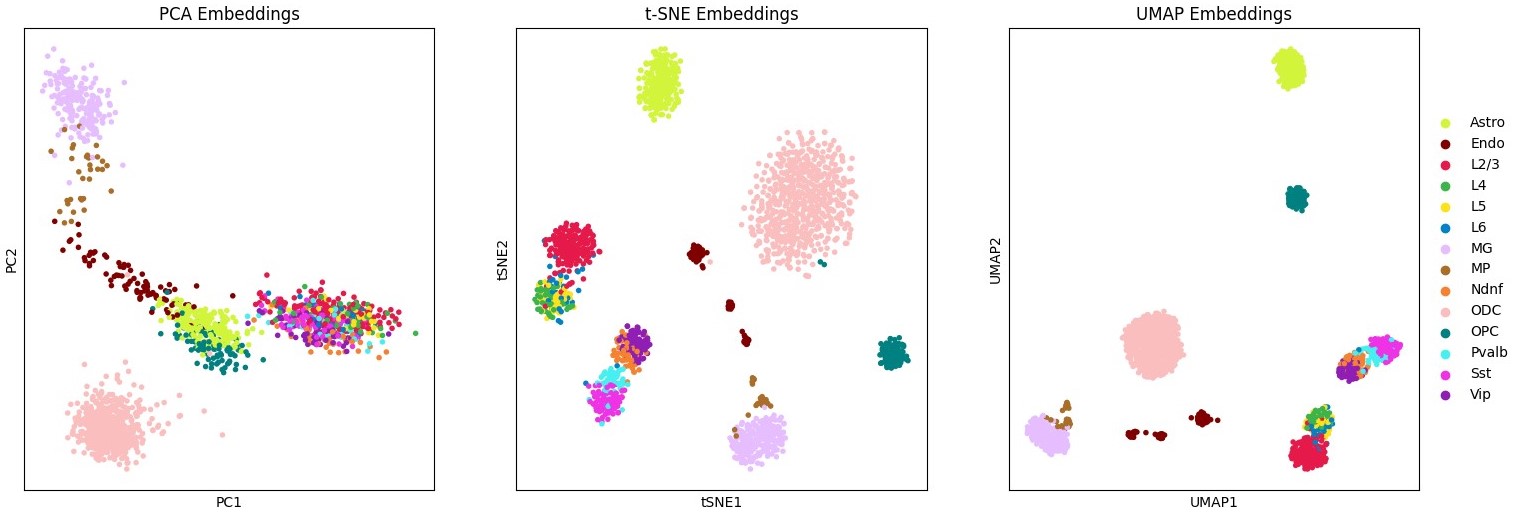
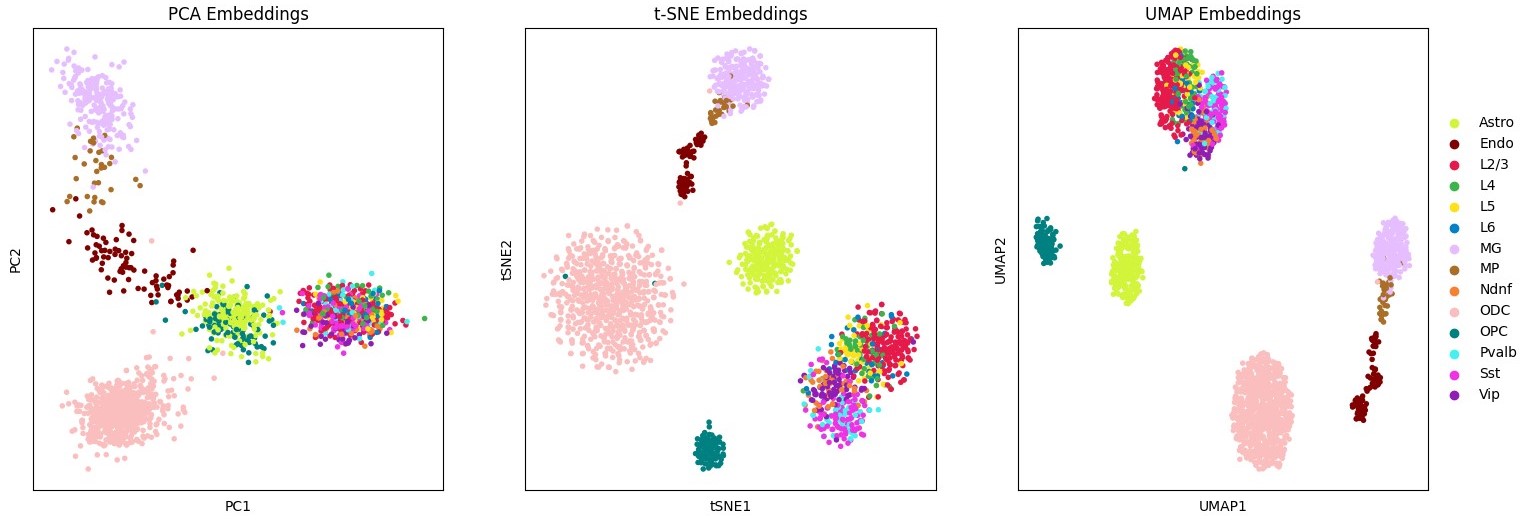
A Python package developed by the Jin Lab for combining, benchmarking, and extending methods of embedding, clustering, and visualizing single-cell Hi-C data.
git clone https://github.com/JinLabBioinfo/SCORE.git;
cd SCORE;
pip install .
Installation should only take a few minutes.
Some methods such as Va3DE rely on GPU accelerated Tensorflow builds. Make sure you are using a GPU-build by running
pip install tensorflow[and-cuda]We also provide Va3DE as a standalone package which can be installed here: https://github.com/JinLabBioinfo/Va3DE
Other methods such as Higashi rely on GPU accelerated builds of PyTorch.
You can verify that the installation was successful by running
score --helpWe provide some tutorials to help you get started:
The following embedding methods can be run using the --embedding_algs argument (not case sensitive):
- scHiCluster (
scHiCluster) - fastHiCRep+MDS (
fastHiCRep) - InnerProduct+MDS (
InnerProduct) - scHi-C Topic Modeling (
cisTopic) - SnapATAC2 (
SnapATAC) - scGAD (
scGAD) (requires additional R dependencies) - Insulation Scores (
Insulation) - DeTOKI (
deTOKI) - scVI-3D (
3DVI) - Higashi (
Higashi) - Fast Higashi (
fast_higashi/fast-higashi) - Va3DE (
VaDE/Va3DE)
We also provide additional baseline methods for benchmarking:
1D_PCA(sum all interactions at each bin, embed 1D counts with PCA)2D_PCA(extract band of interactions, embed with PCA)scVI(sum all interactions at each bin, train scVI model)scVI_2D(extract band of interactions, train scVI model)
We provide a small example dataset in the examples/data directory. To run SCORE you simple need to provide an input .scool file and a metadata reference file. You can specify the embedding tool(s) you wish to test using the --embedding_algs argument
score embed --dset oocyte_zygote \  # name for saving results
            --scool oocyte_zygote_mm10_1M.scool \  # path to scool file
            --reference oocyte_zygote_ref \  # metadata reference
            --embedding_algs InnerProduct \  # embedding method name
            --n_strata 20 \
This will create a new results directory (or a directory specified by --out) where results are stored under the name specified by --dset. Visualizations are generated for celltypes and other metadata provided, and if multiple celltype labels are provided, clustering metrics will be computed and stored as well. Additional analysis and visualization can be easily performed with the anndata_obj.h5ad Scanpy object which is saved with each run. Most baseline methods on this small dataset should only take a few minutes to run.
We also provide the datasets analyzed in our benchmark publication at various resolutions which can be downloaded from the following to reproduce our results:
wget hiview10.gene.cwru.edu/~xww/scHi-C_data.tar.gzFor example, to reproduce the short-range complex tissue analysis, we can run:
score embed --dset pfc \  # name for saving results
            --scool pfc_200kb.scool \  # path to scool file
            --reference pfc_ref \  # metadata reference
            --embedding_algs InnerProduct \  # embedding method name
            --n_strata 10 \  # 0-2Mb
            --min_depth 50000  # filter low depth cells
score embed --dset pfc \ # name for saving results
--scool pfc_200kb.scool \ # path to scool file
--reference pfc_ref \ # metadata reference
--embedding_algs InnerProduct \ # embedding method name
--strata_offset 10 \ # ignore first 10 strata (i.e 0-2Mb)
--n_strata 100 \
--min_depth 50000Including multiple embedding methods and executing multiple runs using --n_runs will produce a local benchmark on the dataset provided:
score embed --dset embryo \  # name for saving results
            --scool embryo_500kb.scool \  # path to scool file
            --reference embryo_ref \  # metadata reference
            --ignore_filter \  # keep all cells
            --embedding_algs 1d_pca InnerProduct scHiCluster \
            --n_runs 10
