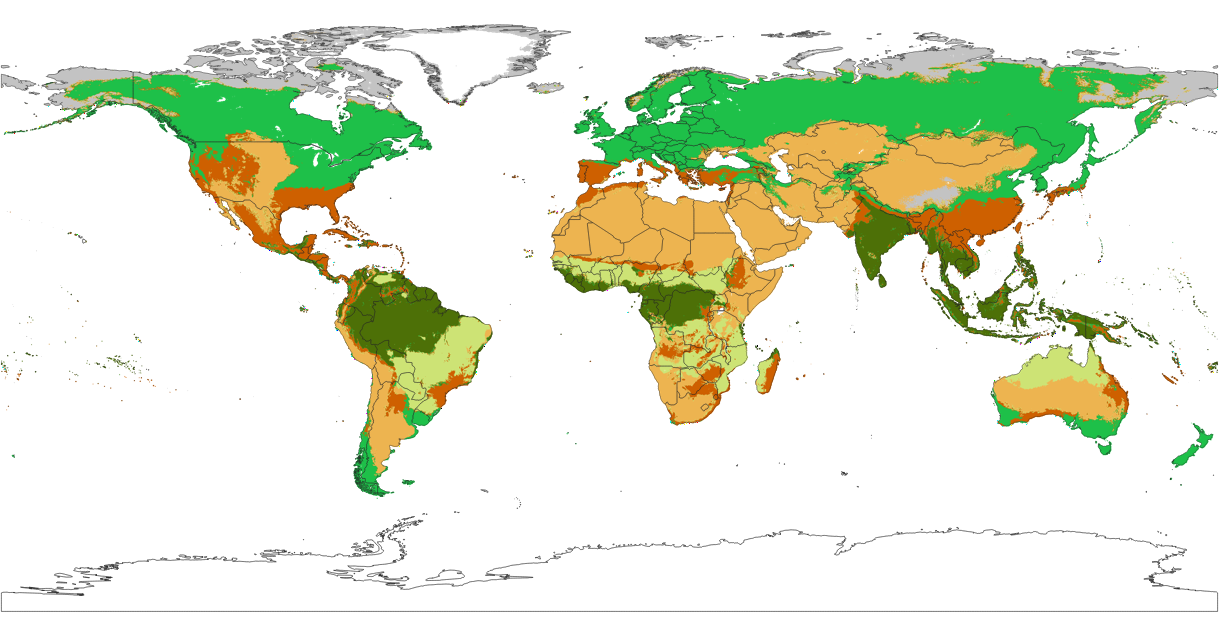
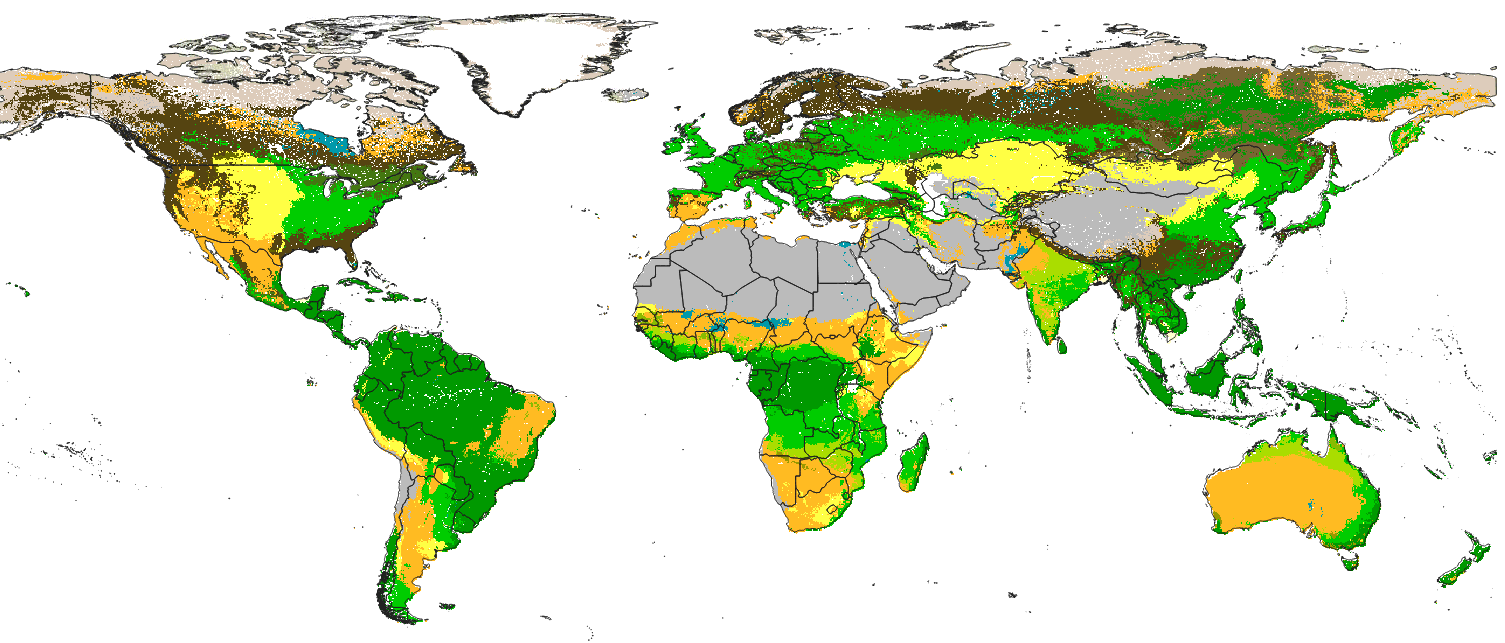
Future projections of Potential Natural Vegetation across different climatic scenarios based on Machine Learning
PNV predictions of the general IUCN classes and BIOME 6000 classes at 1 km spatial resolution are available for download.
Improvements in the future projections of the PNV biomes maps at 1km:
- Only 72 covariates were used (temperature, precipitation and topographical covariates), but model accuracy was doubled,
- Predictions are based on the Ensemble Machine Learning (
"classif.ranger", "classif.glmnet", "classif.xgboost") as implemented in the mlr package, - Predictions are provided in the original BIOME 6000 classification system (20 classes) and the IUCN Global Ecosystem Typology classification system
- Model errors are provided per class (derived as the weighted standard deviation between multiple models) for single class maps,
- Model errors are provided using the margin of victory (Calderón-Loor et al., 2021) for hard classes maps,
- Model fine-tuning and accuracy assessment is based on repeated 5-fold spatial cross-validation,
- Predictions are provided for current and future epochs (2040-2060 and 2060-2080) under three climatic scenarios (RCP 2.6, RCP 4.5 and RCP 8.5).
PNV predictions of the general land cover classes at 250 m spatial resolution is available for download.
Update of the predictions at 250 m spatial resolution is available for download.
Improvements in the v0.2 of the PNV biomes map at 250 m:
- 40% of new covariates have been added (see the variable importance list)
- Predictions are based on the Ensemble Machine Learning (
"classif.ranger", "classif.glmnet", "classif.xgboost", "classif.nnTrain") as implemented in the mlr package, - Model errors are provided per class (derived as the weighted standard deviation between multiple models),
- Model fine-tuning, feature selection and accuracy assessment is based on repeated cross-validation,
Summary: This repository contains R code and some outputs of spatial predictions related with the production of Global Maps of Potential Natural Vegetation. Three case studies were considered: (1) global distribution of biomes based on the BIOME 6000 data set (8057 modern pollen-based site reconstructions), (2) distribution of forest tree species in Europe based on detailed occurrence records (1,546,435 ground observations), and (3) global monthly Fraction of Absorbed Photosynthetically Active Radiation (FAPAR) values (30,301 randomly-sampled points).
This tutorial explains how to fit models and produce predictions for smaller area in Europe. To run this tutorial you might need to install and customize some R / OS GIS software.
Please cite as:
- Hengl T, Walsh MG, Sanderman J, Wheeler I, Harrison SP, Prentice IC. 2018. Global mapping of potential natural vegetation: an assessment of machine learning algorithms for estimating land potential. PeerJ 6:e5457 https://doi.org/10.7717/peerj.5457
The 250m resolution predictions of biomes are available for download from https://doi.org/10.5281/zenodo.3526619
The 1km resolution maps are available for download under the Open Database License (ODbl) v1.0 and can be downloaded from http://dx.doi.org/10.7910/DVN/QQHCIK without restrictions.
These are premilimary maps of the Global Potential Natural Vegetation. Errors and artifacts are still possible. Training data sets BIOME 6000 and EU Forest are constantly being updated and could still contain erroneously geolocated points. Predictions of FAPAR are based on randomly simulated points and not on ground observations of FAPAR and classification of sites. Predictions of EU forest tree species are presented for experimental purposes only. To report an issue or artifact in maps, please use https://github.com/envirometrix/PNVmaps/issues.


