Code debug made easier and more enjoyable. This WordPress plugin includes a suite of developer essential tools to debug your code.
Here's what you get:
- Better PHP error interface from (Whoops)
- Better variable inspection - no need to use
var_dump,print_r, or X-debug - An interactive way to back trace the program's execution order
- PHP 5.6 and up
- Better Variable Inspection
- Backtracing the Call Stack
- Better PHP Error Interface
- Admin Bar Indicator
Watch an introductory video on Vimeo
Though X-debug is powerful, it can be difficult to set up and run. For that reason, it's common to dump or print out the variable to browser. But the built-in display for the PHP var_dump and print_r is basic.
This plugin includes both two very popular variable dumper tools:
VarDumper provides a simple container that displays where you place it.
Kint gathers all the data and displayed it at the bottom of the screen as a fixed position container. It also provides a call stack, which can be handy, and tracing functionality if you need it.
It depends.
- You want to simply display the contents of a variable: Use VarDumper's functions, i.e.
vdump(),vd(),vdd(), orvddd(). - You want the call stack in addition to the variable: Use Kint's functions:
d(),dd(), orddd().
| Task | VarDumper | Kint |
|---|---|---|
| Dumps the given variable(s) | vdump( mixed $var ); |
dump( mixed $var [ , mixed $var2, ...] ); |
| Dumps and dies | vdump_and_die( mixed $var ); |
dump_and_die( mixed $var [ , mixed $var2, ...] ); |
TIP Use the full functions instead of the aliases. Why? It's easier to search your code to find where you put each of them. Searching for
d(, for example, can be frustrating. But searching fordump(, that will be a more targeted search.
Alias (shorthand) Functions
| Task | VarDumper | Kint |
|---|---|---|
| Dumps plain text | na | s( mixed $var [ , mixed $var2, ...] ); |
| Dumps the given variable(s) | vd( mixed $var ); |
d( mixed $var [ , mixed $var2, ...] ); |
| Dumps and dies | vdd( mixed $var ); |
dd( mixed $var [ , mixed $var2, ...] ); |
| Dumps and dies | vddd( mixed $var ); |
ddd( mixed $var [ , mixed $var2, ...] ); |
Using the VarDumper functions:
add_action( 'loop_start', function() {
	global $post;

	$array = [
		'ID'    => get_the_ID(),
		'title' => get_the_title(),
	];

	vdump( $array );
	vdump_and_die( $post );
} );
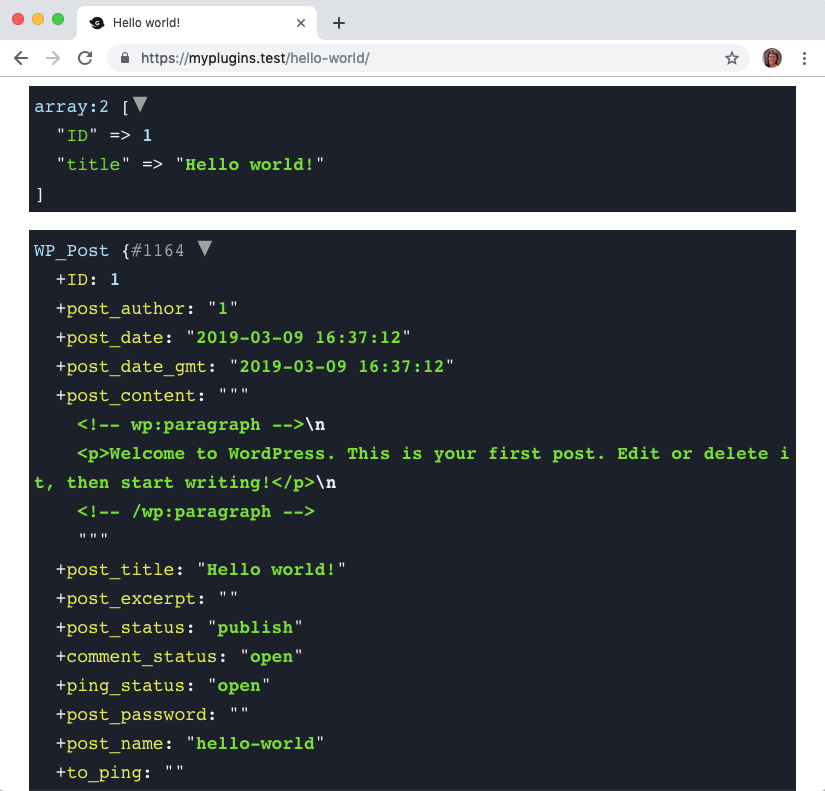
It renders like this:
Using the Kints functions:
add_action( 'loop_start', function() {
	global $post;

	$array = [
		'ID'    => get_the_ID(),
		'title' => get_the_title(),
	];

	dump( $array );
	dump_and_die( $post );
} );
It renders like this:
Notice the subtle differences between them:
- VarDumper's functions provide a very simple highlighter container.
- Kint is shown at the bottom of the screen. Notice that it provides more information.
Here's the example code for s():
add_action( 'loop_start', function() {
	$array = [
		'ID'    => get_the_ID(),
		'title' => get_the_title(),
	];

	s( $array );
} );
It renders as:
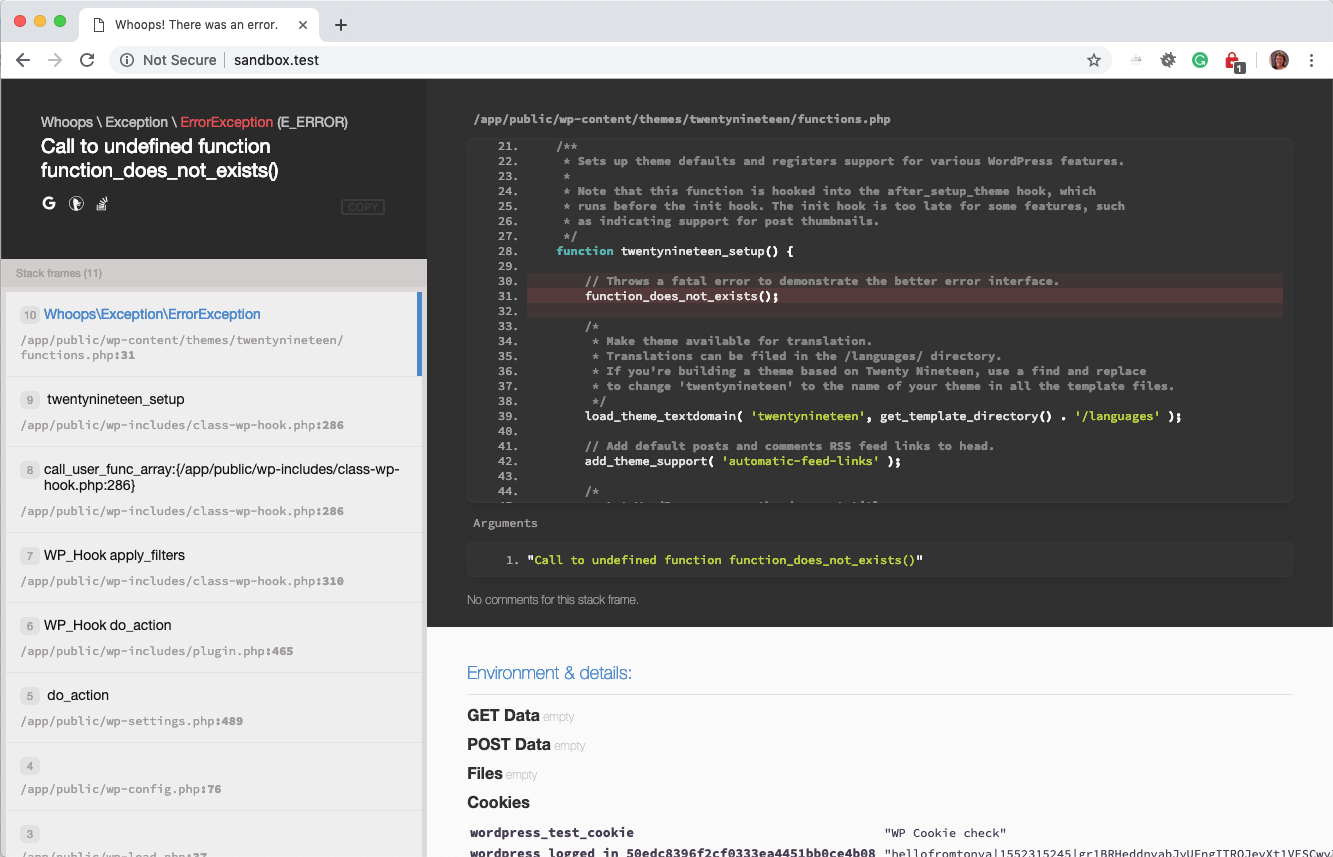
The built-in PHP error container is basic and not as helpful as it could be. On top of that, it's rather ugly. Wouldn't you agree?
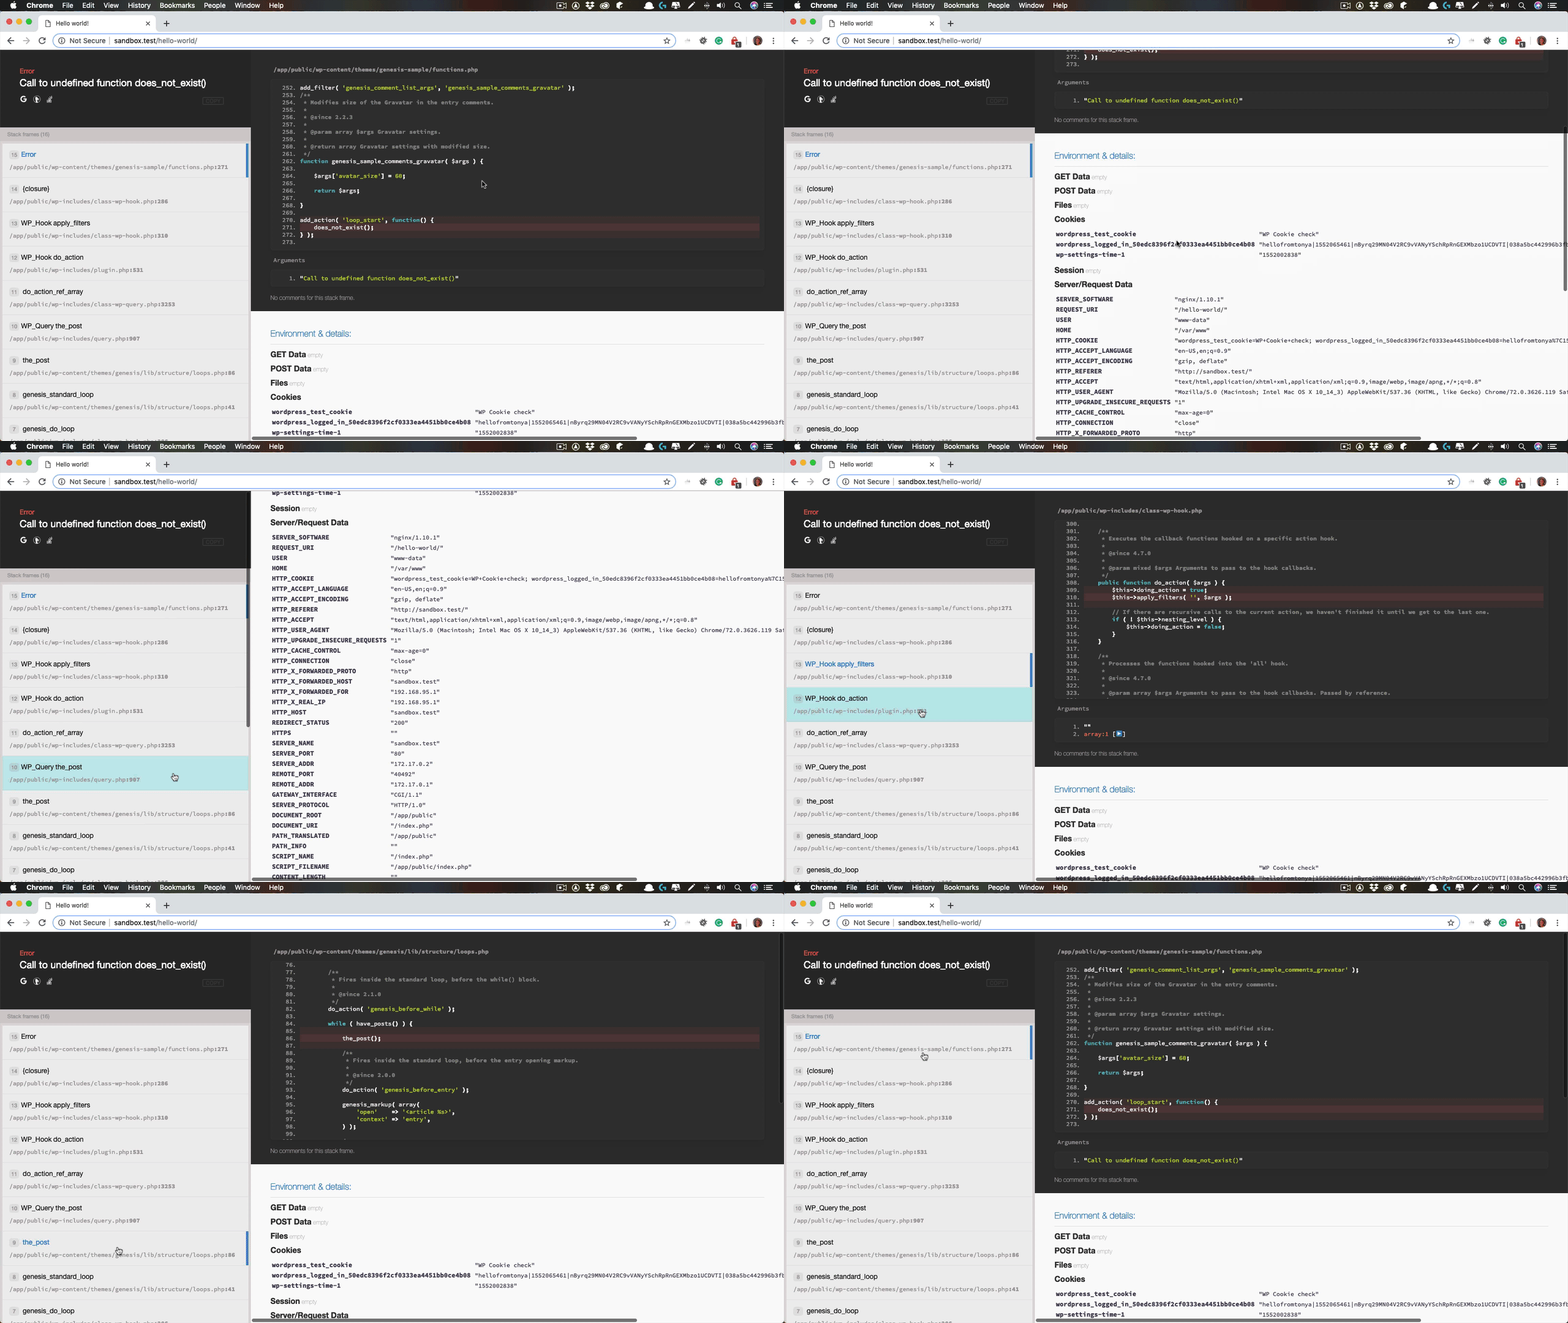
The Whoops package gives you a cool interface that is helpful, interactive, and quite nice to look at.
Consider the error this code would produce:
add_action( 'loop_start', function() {
	does_not_exist();
} );
You can learn more about Whoops by visiting http://filp.github.io/whoops/.
When debugging, there are times when you need to see the order in which functions were called that lead to a certain point in the program. PHP offers a backtrace that traces back the execution order from the point when the function is invoked.
To make backtracing easier, this plugin provides you with a trace() function and combines it with the variable dumper functions.
| Task | VarDumper | Kint |
|---|---|---|
| Dumps backtrace | na | trace(); |
| Dumps backtrace + given variable(s) | trace_vdump( mixed $var ); |
trace_dump( mixed $var [ , mixed $var2, ...] ); |
| Dumps backtrace + variable(s) and then dies | trace_vdump_and_die()( mixed $var ); |
trace_dump_and_die()( mixed $var [ , mixed $var2, ...] ); |
| Alias for trace and dump | trace_vdump_and_die()( mixed $var ); |
traced()( mixed $var [ , mixed $var2, ...] ); |
| Alias for trace and dump and die | tracevdd()( mixed $var ); |
tracedd()( mixed $var [ , mixed $var2, ...] ); |
| Alternative alias for trace and dump and die | tracevddd()( mixed $var ); |
traceddd()( mixed $var [ , mixed $var2, ...] ); |
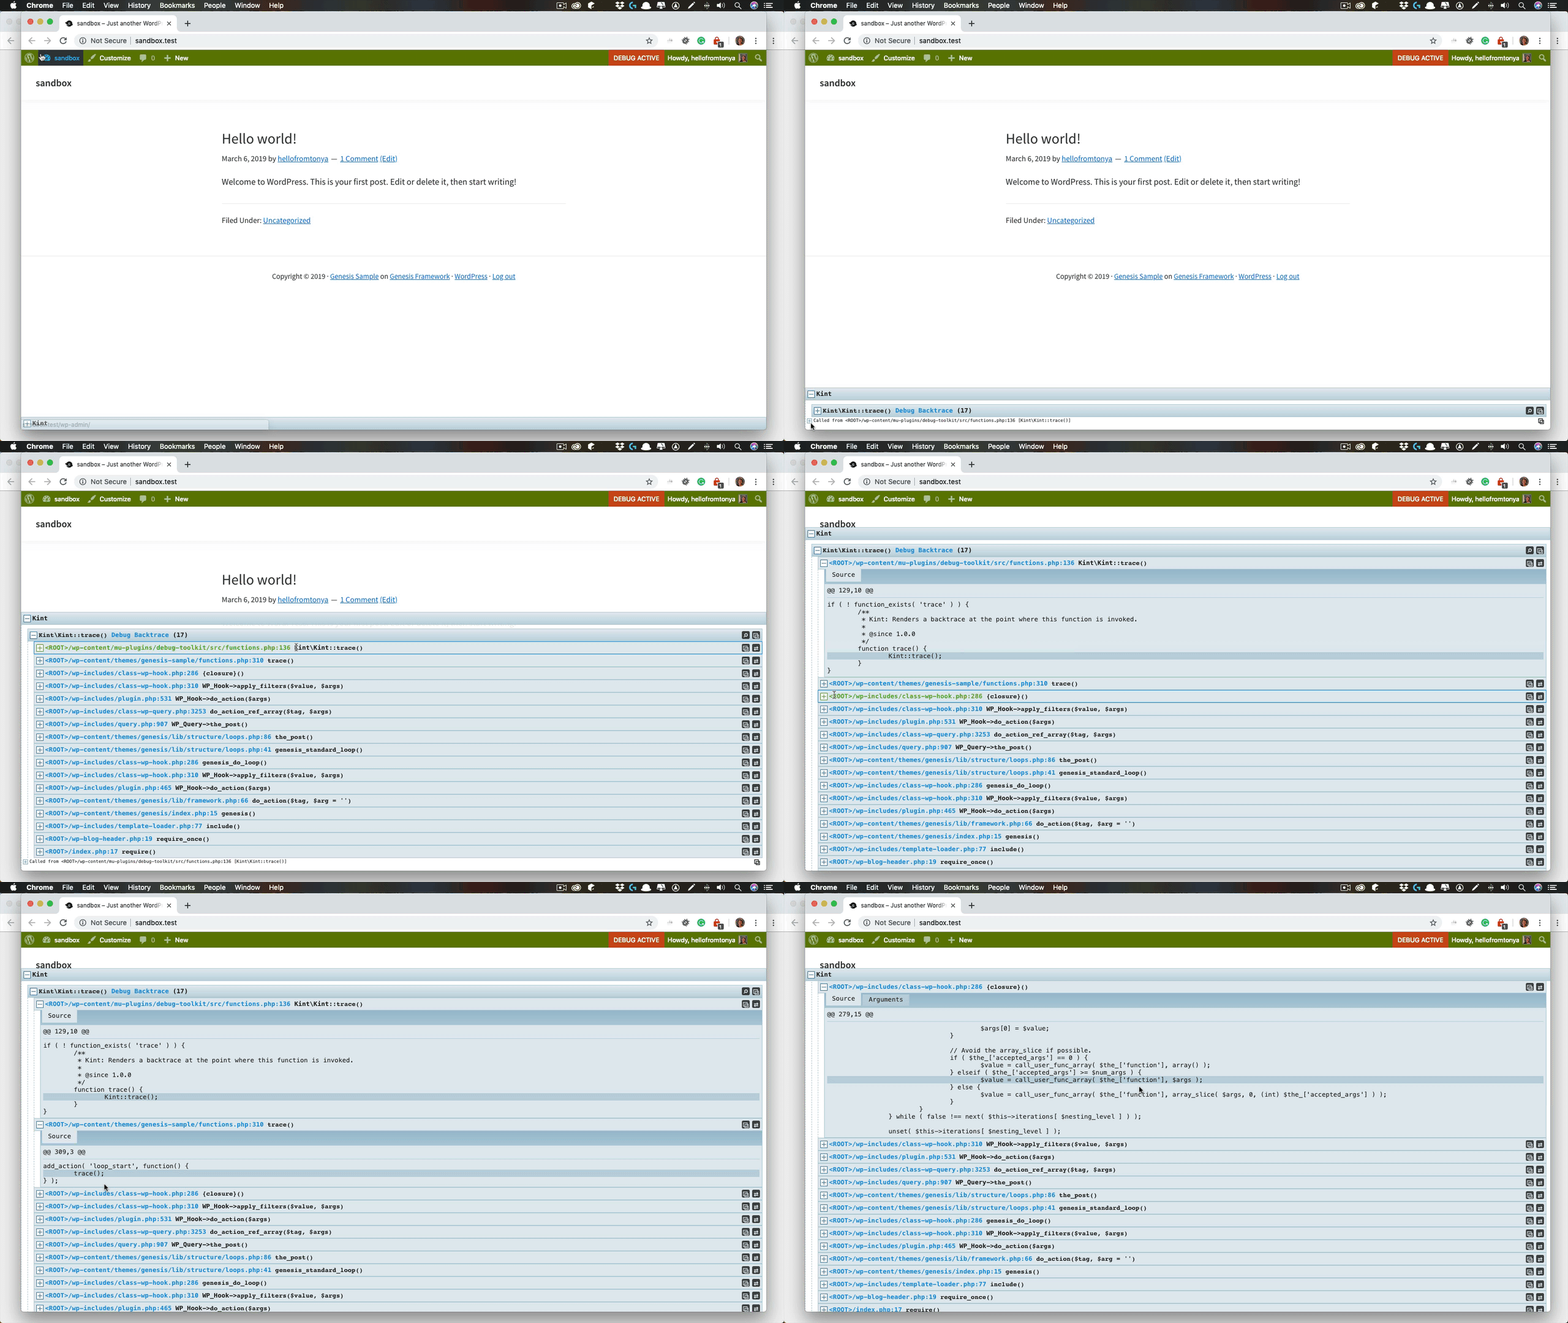
The trace(); function will render the call stack that lead up to where you invoke the function. For example, if you added this code at the end of your theme's functions.php file:
add_action( 'loop_start', function() {
	trace();
} );
the trace() renders as:
Notice that the container is interactive. Click on each call stack item and its associated code appears. This is a powerful debugging tool to discover the execution order through your code.
As this tool is meant for development mode only, you need a way to know the plugin is enabled. No problem. A "DEBUG MODE" indicator is added to the WordPress admin bar.


