- Business Analytics Practicum Course Project(DNSC 6217), Attain, LLC, Washington DC
- Time: Sep. 2018 – Dec. 2018
- Participants: Xuan Yang, Mengchen Xiao, Weihang Wen, Yinian Lyu, Weichao Zhu
- Instructor: Prof. Shivraj Kanungo
- Company Main Contacts: Tim Pavlick(tpavlick@attain.com), Alex Brown(abbrown@attain.com)
- Final Report: BA Practicum Final Report.pdf
Improving the digital consulting platform with AI & Analytics The team is experimenting with several areas of Attain’s digital consulting platform to bring analytics to bear. The following mini-projects will combine to create an overall analytics upgrade to Attain’s digital consulting platform:
-
Improve ‘Service Selector’. After we have identified the customer & the customer's requirements, then we source those requirements to Attain capabilities. From the ‘Service Categories’ various services can be selected. The team is working on optimizing the ‘association rules’ which suggest complimentary service sets (to planners).
-
Improve ‘Staffing’ visibility. One of the capabilities Attain applies to jobs is skilled workers. These staffs are currently listed by name. The team is using machine learning to cull through Attain resumes by skill. Once completed planners will be able to select staff, for a job, by querying which staff possesses a given skillset.
-
Design an Analytics Managed Service. AttainAnswers will be an online platform for the delivery of traditional consulting services & Asset-based consulting. An evolution beyond that would be ‘Analytics Managed Services’. Based on a prior engagement pattern, the team is designing & building a prototype of an Analytics Managed Service to be exposed and offered on the AttainAnswers platform.
-
Consulting Risks Analysis. A key execution aspect in consulting engagements is risk management. The team took Attain data, detailing the risk profiles of engagements, and analyzed them for a cause. Insights culled from this analysis will inform how the ‘risk features’ of AttainAnswers will be designed to best assist engagement planners.
-
Bonus task. If time allows the team will examine the AttainAnswers lifecycle and make recommendations for how to analyze holistic engagement performance such that AttainAnswers will become smarter over time. With this insight, the platform can direct executives as to how the customer, partner or Attain fulfillment trends are changing over time.
- Improved Association Rule Mining Analysis to train machine learning model in order to match customers’ demand with Attain’s service using Python Apriori algorithms;
- Used Attain Answers AI library for text mining analysis on more than 100 Attain resumes, which allows Attain to search by specific skills needed, for a given job, and to find the correct person based on Python LDA algorithms;
- Researched, preformed, completed social network analysis and human behaviors analysis projects on Anti-semitism & Antifa topic using Webhose.io API, and Meltego;
- Organized, explored, analysed, visualized Attain risk data to predict recurring risks from 13 independent variables provided, e.g., schedule, budget, etc.using R, Tableau, SAS Time Series Analysis.
Association rule mining (ARM) is a useful data mining technique to detect patterns and rules. To provide better service for Attain’s customers and understand better their demand patterns, it’s significant to improve the current association ARM algorithm according to different dataset features and different technical requests.
To perform ARM, the collected information is analyzed and a number of relevant rule criteria are detected. One of the applied algorithm is Apriori. Apriori finds rules and relations among variables in a data set. The algorithm finds frequent patterns and calculates the rule’s several indices. Support and confidence, are the two major indices, which have useful applications to evaluate the rules. Lift is the third but the most important index. Lift(A -> B) refers to the increase in the ratio of sale of B when A is sold. Lift(A –> B) can be calculated by dividing Confidence(A -> B) divided by Support(B).
For large sets of data, there can be hundreds of items in hundreds of thousands transactions. The Apriori algorithm tries to extract rules for each possible combination of items. This process can be extremely slow due to the number of combinations. To speed up the process, we need to perform the following steps:
- Set a minimum value for support and confidence. This means that we are only interested in finding rules for the items that have certain default existence (e.g. support) and have a minimum value for co-occurrence with other items (e.g. confidence).
- Extract all the subsets having higher value of support than minimum threshold.
- Select all the rules from the subsets with confidence value higher than minimum threshold.
- Order the rules by descending order of Lift.
Specifically, we respectively implement python code step by step. As first step, we use generate_rules to take dataframes of frequent itemsets as produced by the apriori function in mlxtend.association when we want to generate association rules from frequent itemsets. The generate_rules() function allows you to (1) specify your metric of interest and (2) the according threshold.
  import pandas as pd
  from mlxtend.preprocessing import TransactionEncoder
  from mlxtend.frequent_patterns import apriori


  dataset = [['Milk', 'Onion', 'Nutmeg', 'Kidney Beans', 'Eggs', 'Yogurt'],
       ['Dill', 'Onion', 'Nutmeg', 'Kidney Beans', 'Eggs', 'Yogurt'],
       ['Milk', 'Apple', 'Kidney Beans', 'Eggs'],
       ['Milk', 'Unicorn', 'Corn', 'Kidney Beans', 'Yogurt'],
       ['Corn', 'Onion', 'Onion', 'Kidney Beans', 'Ice cream', 'Eggs']]

  te = TransactionEncoder()
  te_ary = te.fit(dataset).transform(dataset)
  df = pd.DataFrame(te_ary, columns=te.columns_)
  frequent_itemsets = apriori(df, min_support=0.6, use_colnames=True)
  frequent_itemsets

  from mlxtend.frequent_patterns import association_rules
  association_rules(frequent_itemsets, metric="confidence", min_threshold=0.7)
Next, we discuss the condition that when we you are interested in rules according to a different metric of interest, you can simply adjust the metric and min_threshold arguments . E.g. if you are only interested in rules that have a lift score of >= 1.2, you would do the following:
rules = association_rules(frequent_itemsets, metric="lift", min_threshold=1.2)
And then, say, we are ony interested in rules that satisfy the following criteria:
  rules["antecedent_len"] = rules["antecedents"].apply(lambda x: len(x))
  rules[ (rules['antecedent_len'] >= 2) &
        (rules['confidence'] > 0.75) &
        (rules['lift'] > 1.2) ]
Thirdly, when we face with a condition where there are frequent itemsets with incomplete antecedent and consequent information. For example, the confidence is computed as confidence(A→C)=support(A→C)/support(A). But we do not have support(A). In these scenarios, where not all metrix can be computed, due to incomplete input DataFrames, you can use the support_only=True option, which will only compute the support column of a given rule that does not require as much info: support(A→C)=support(A∪C). "NaN's" will be assigned to all other metric columns:
  from mlxtend.frequent_patterns import association_rules
  res = association_rules(freq_itemsets, support_only=True, min_threshold=0.1)
  res = res[['antecedents', 'consequents', 'support']]
  res
Attain also wants to assign the projects or tasks to appropriate people more efficiently at the beginning of a new project. By utilizing Attain’s AI library, we would conduct unsupervised learning on employees resumes to create index for skills so that each resume could be tagged with one or more skills the employee has, which could help to find the right person with the skills in need.
For the resume files from Attain, we did some basic text mining exploration like word count and word cloud visualization, and text transformation using TF-IDF on the given resumes and have been trying to working on the topic clustering based on LDA model.
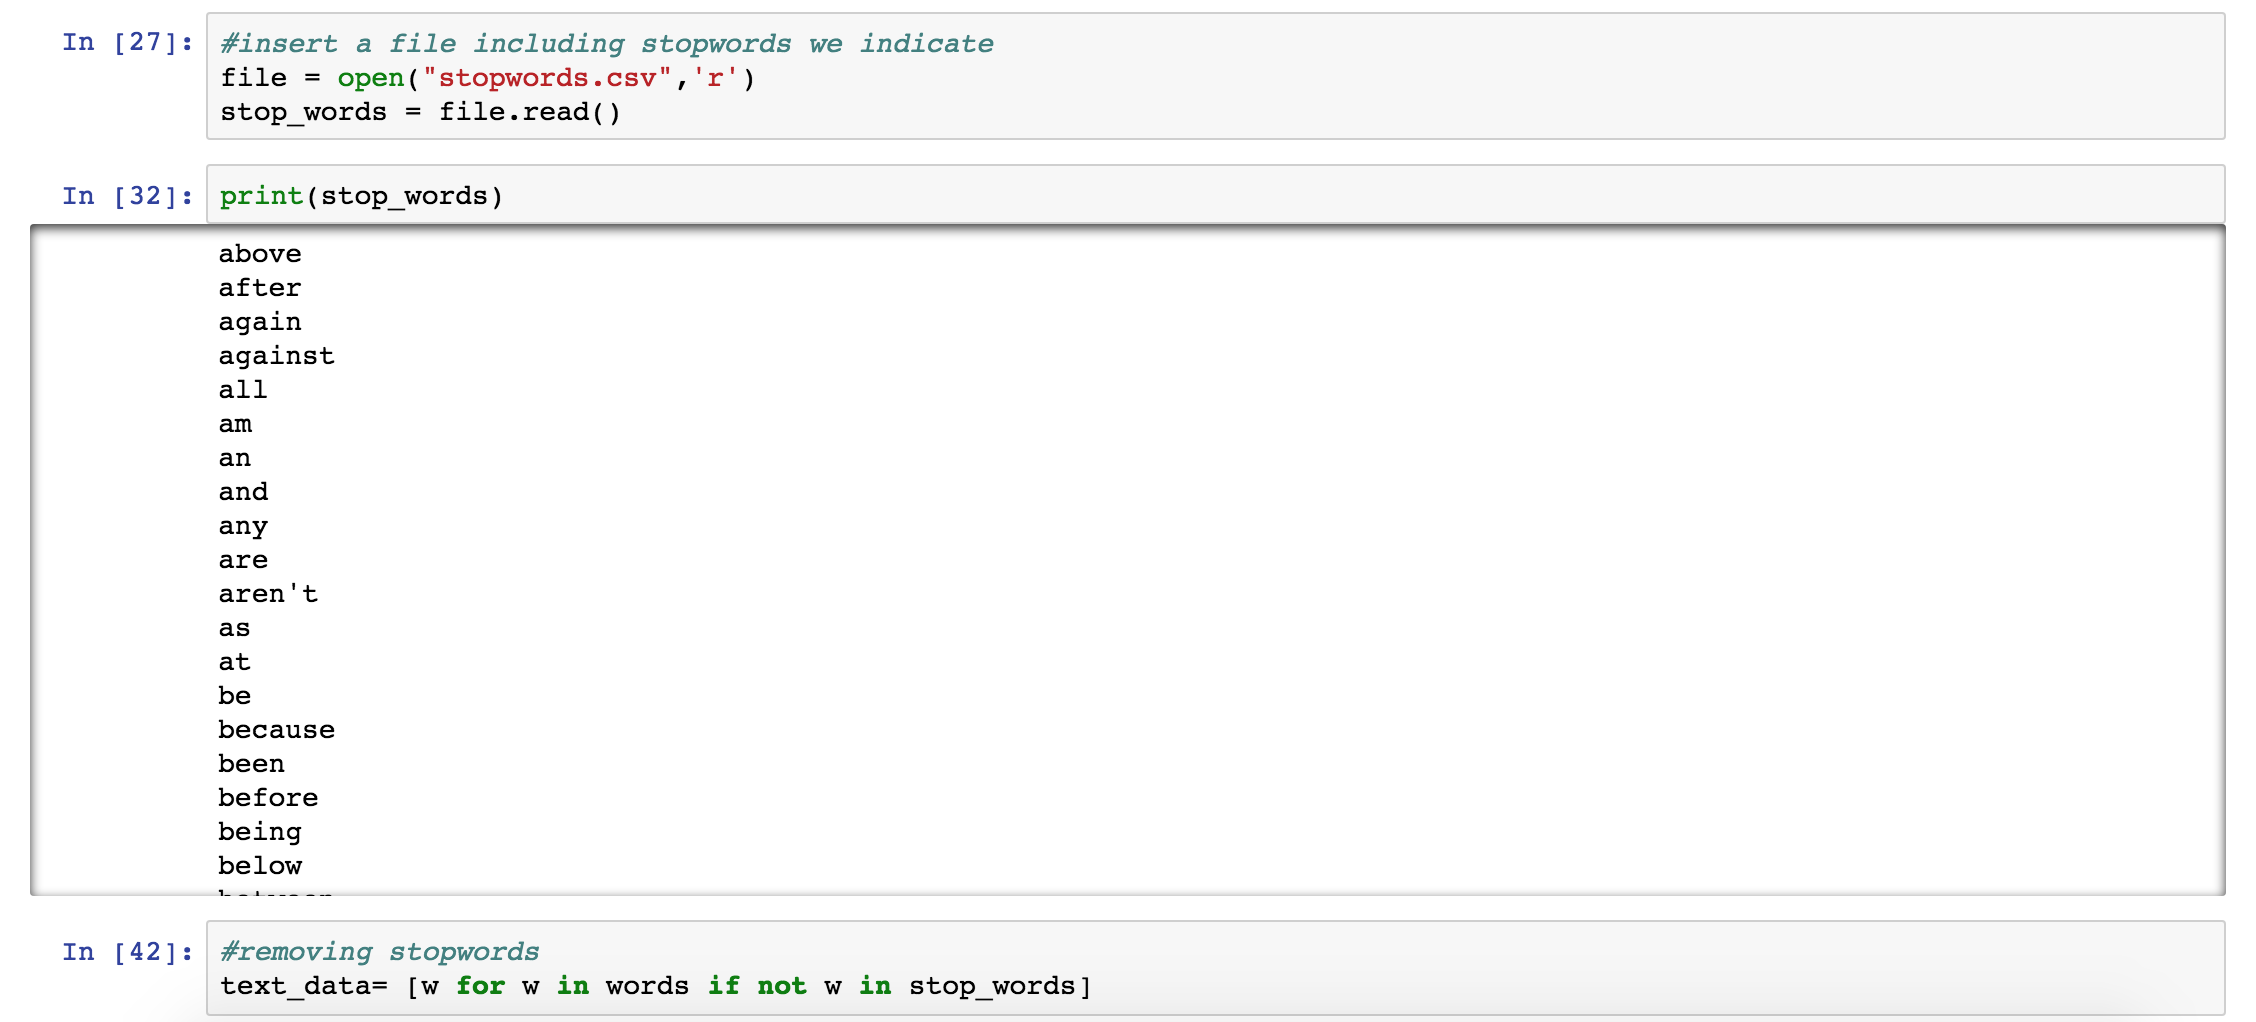
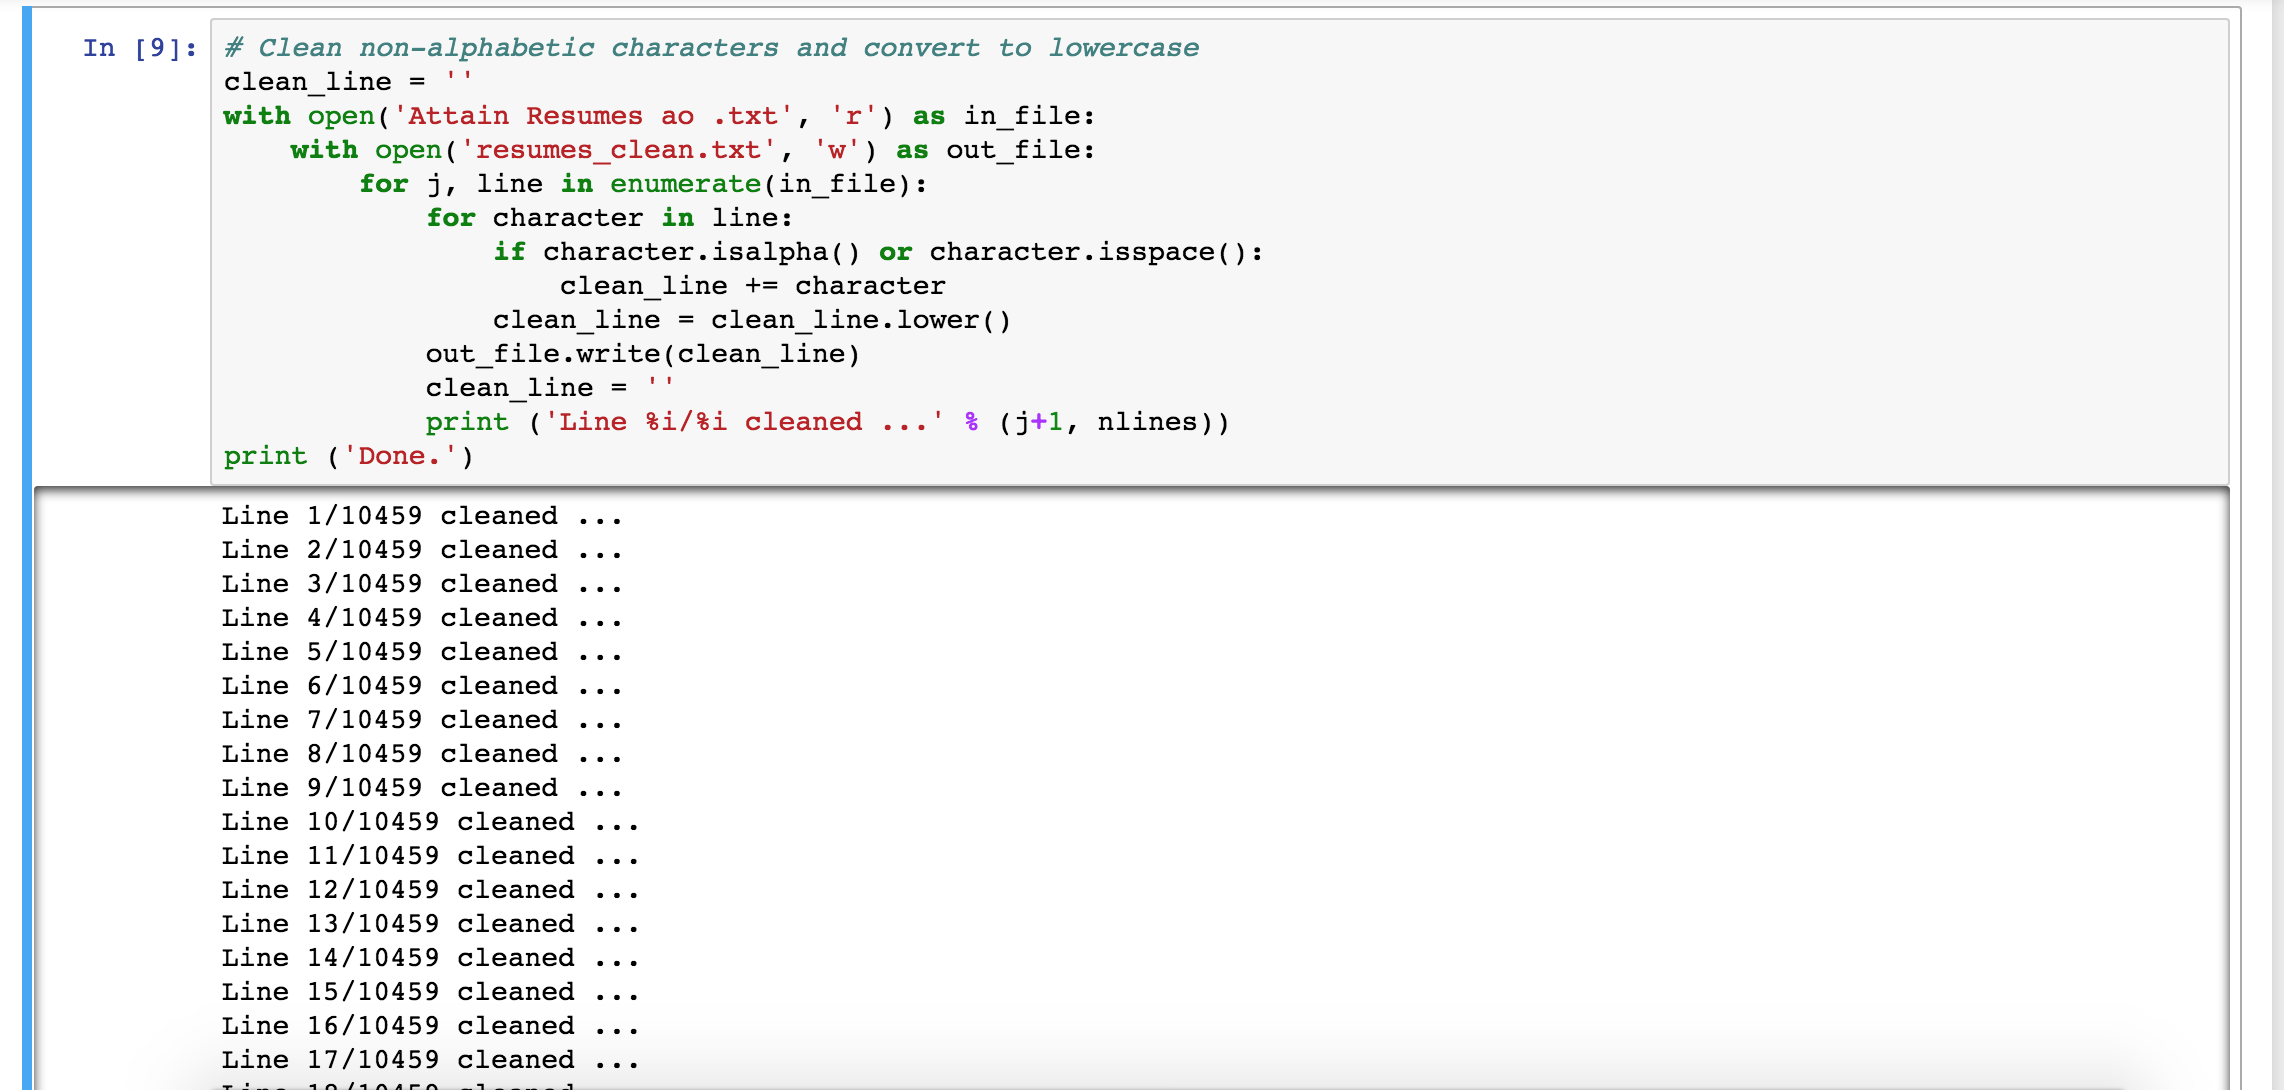
- At first, we did some basic text preprocessing like tokenizer, stemmer, removing stopwords and common punctuations so that the text files are much cleaner for further analysis. See below.
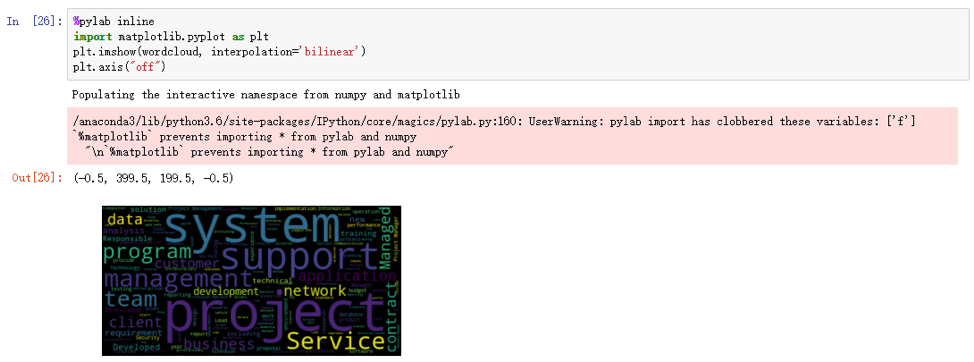
- Here is the word cloud generated from all the resume files, showing the frequency of the words in the resumes of Attain.
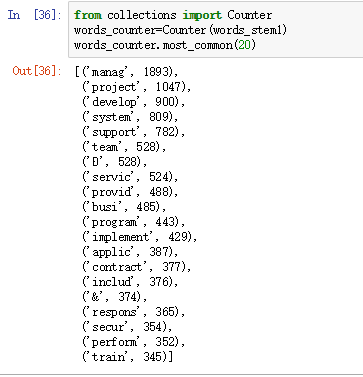
- Here are the 20 most common words from the resume files.
- Here are some common collocations from resume files.
- Here is another exploratory analysis on the resume files that could be useful when we want to analyze some specific words.
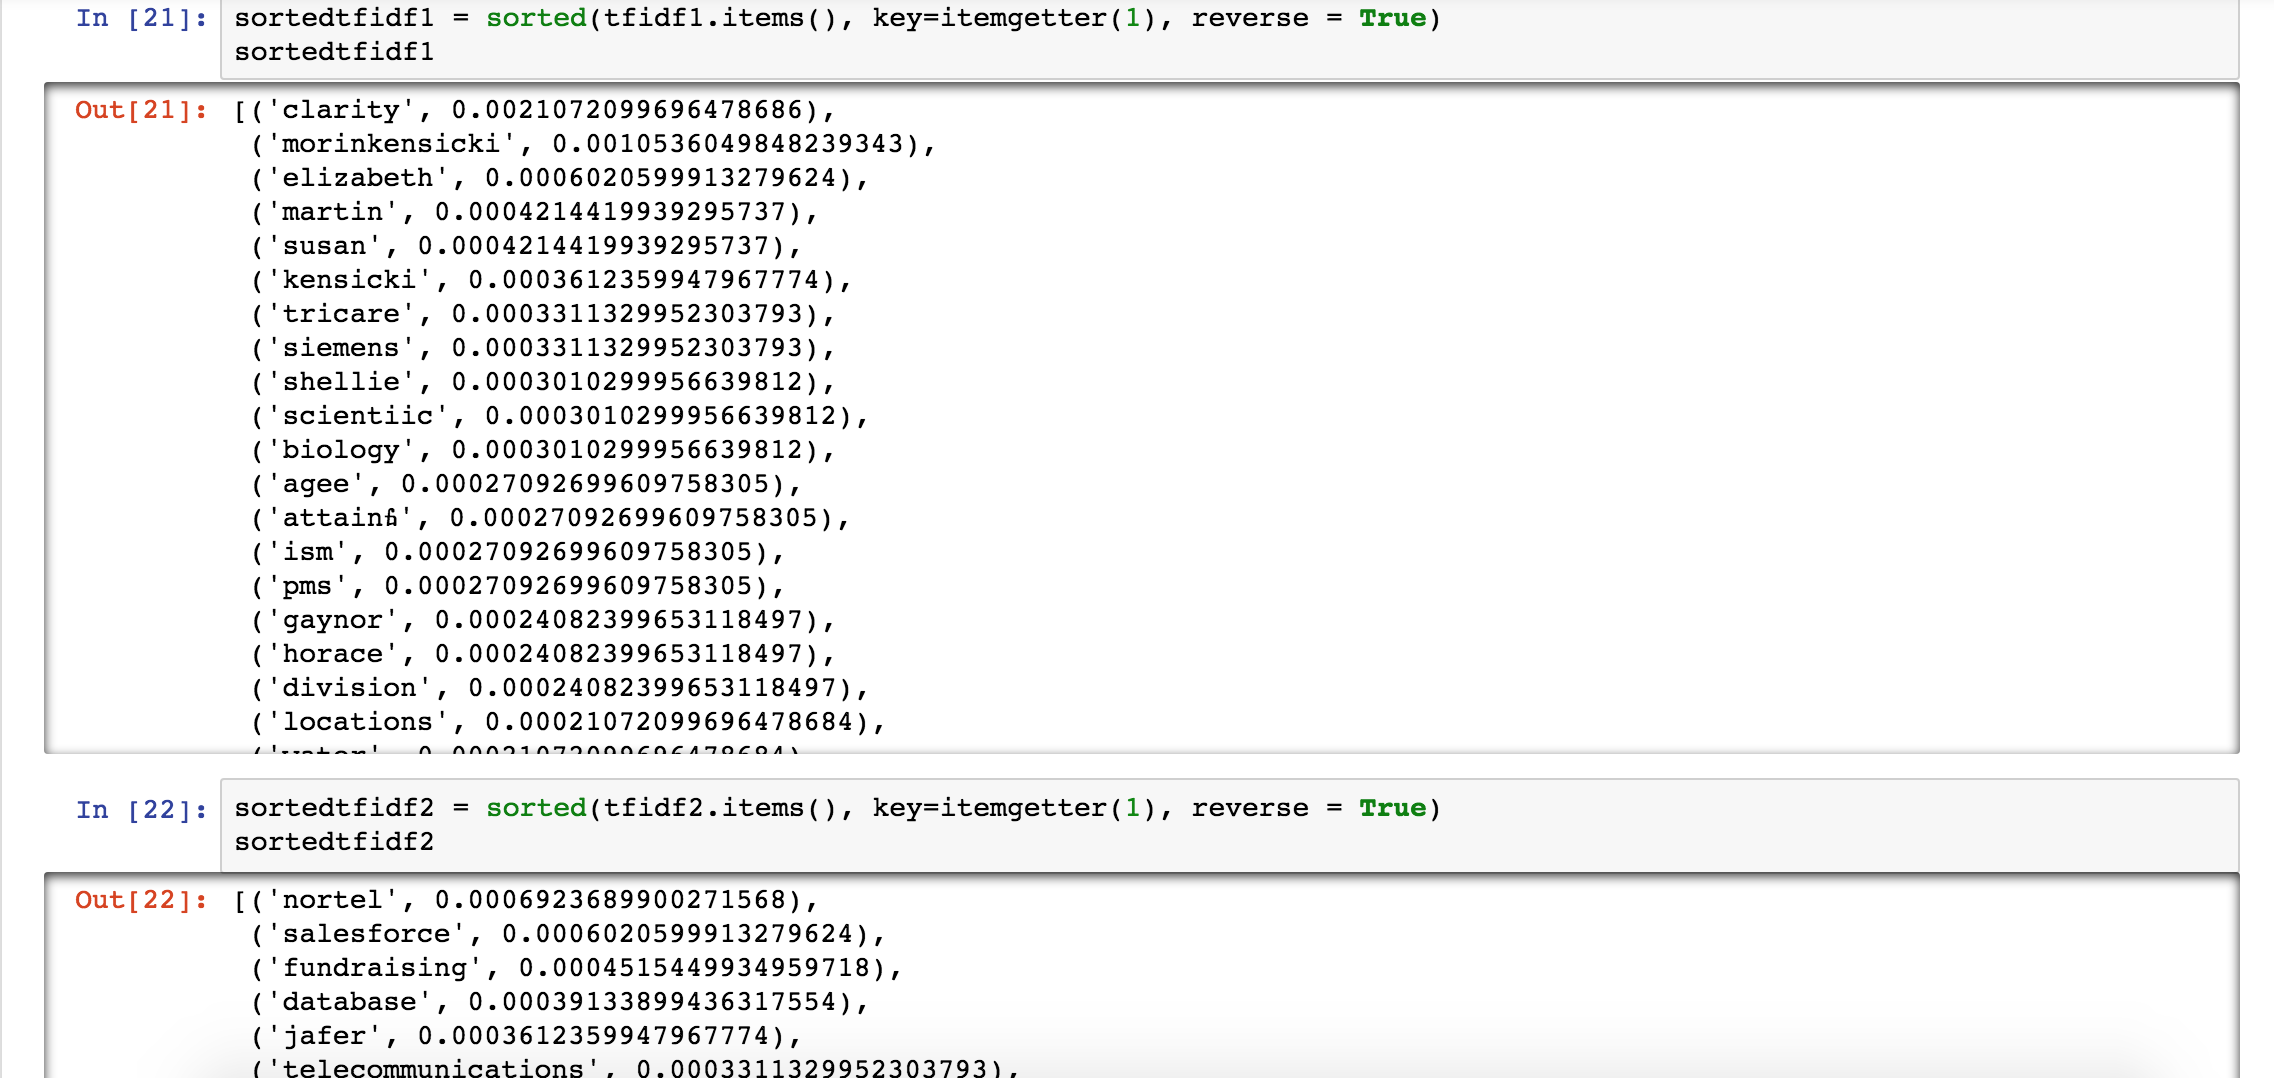
- After resume data clean and data exploration, we next step would like to implement text transformation. We referred to TF-IDF theory. This theory could be divided into two concept: one is importance and the other is frequency. TF stands for term frequency, which equals to count(word) / len(document); IDF stand for inverse document frequency namely term importance, which formulated by log( total number of document / count(document_containing_term)). Then we define TF-IDF function in python and apply to resume data. See Graph 3.7. In the graph, we could find the most feature word of each resume order by value of TF-IDF from high to low.
- The next step is document clustering by using Doc2Vec algorithm. This method differ from word count or TF-IDF or LDA. Because it takes word order into account, but LDA only cares word by word seperately. In the future, we can search a target resume by descripting on word group or sentences level, for example, have 5+ years experience on Python and proficient in project management.
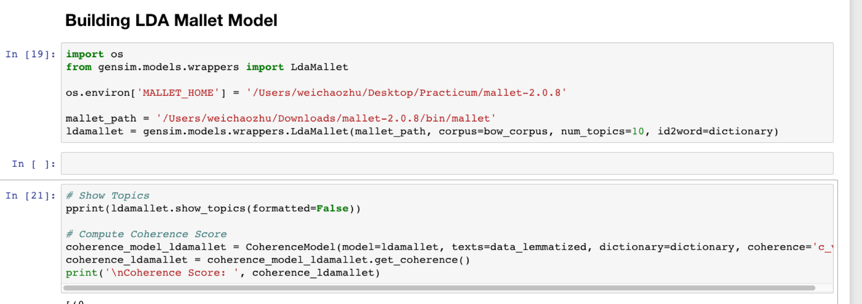
- We also tries to run the data into LDA Mallet Model by using the Gensim package.
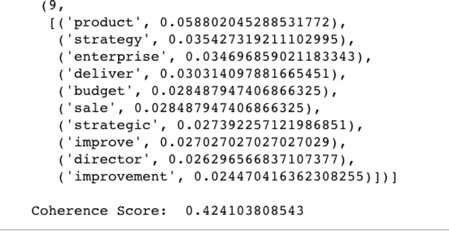
The coherence score we get from the LDA Mallet model is 0.424, which is a good way to judge the performance of the model. Basically, the higher the coherence score, the better the model.
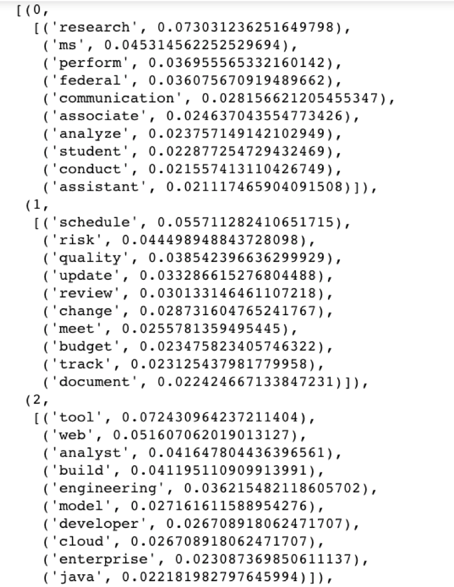
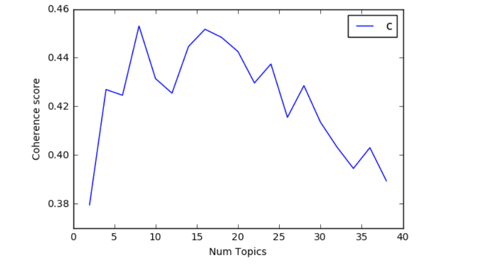
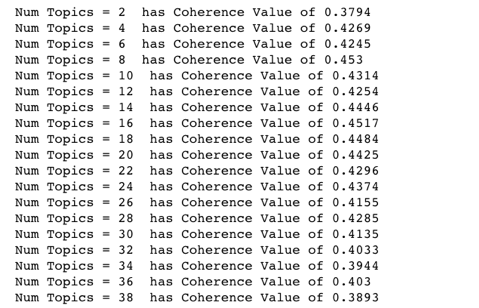
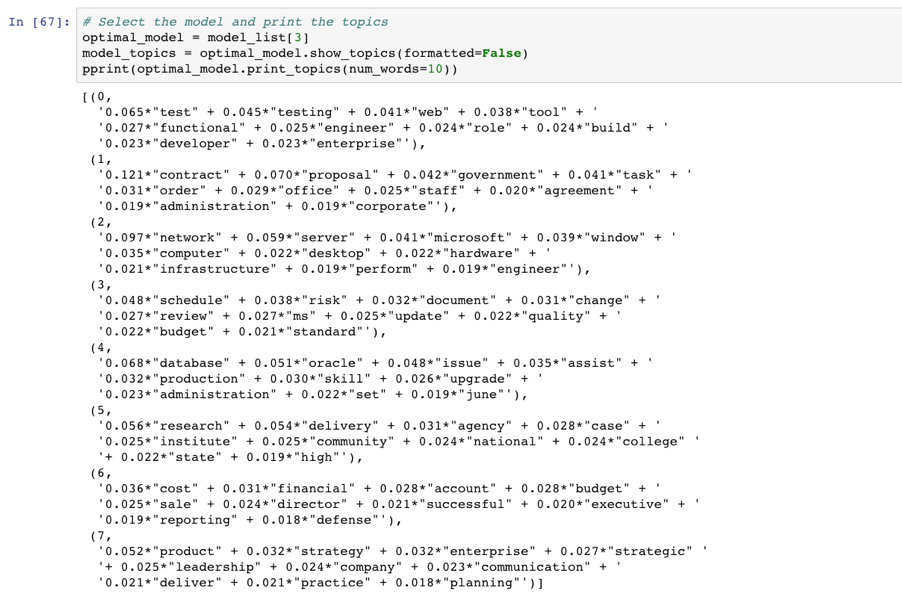
To improve the model, we tried to find the optimal number of topics by trying different values of the number of topics and choose the one that has the highest coherence score. Form the output, we notice that the coherence value is highest(0.453) when the number of topics is 8.
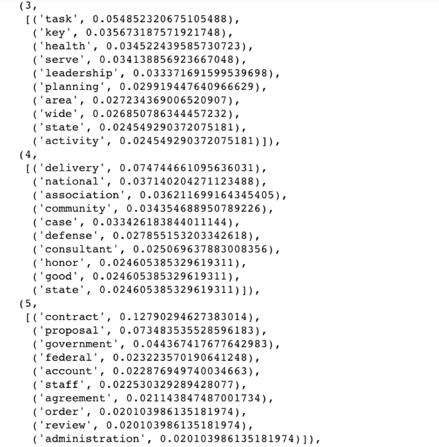
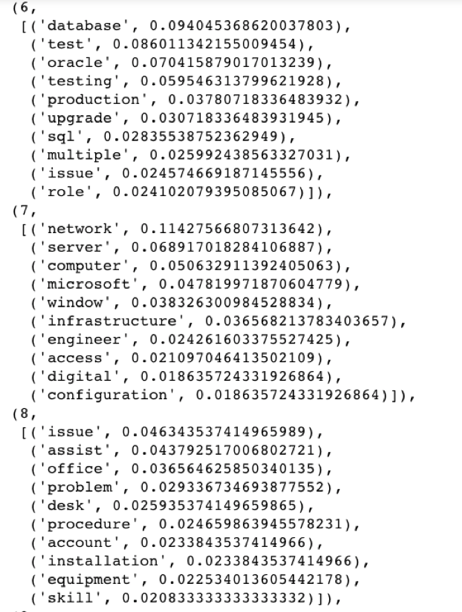
Therefore, we selected this optimal model and printed out the 8 topics below.
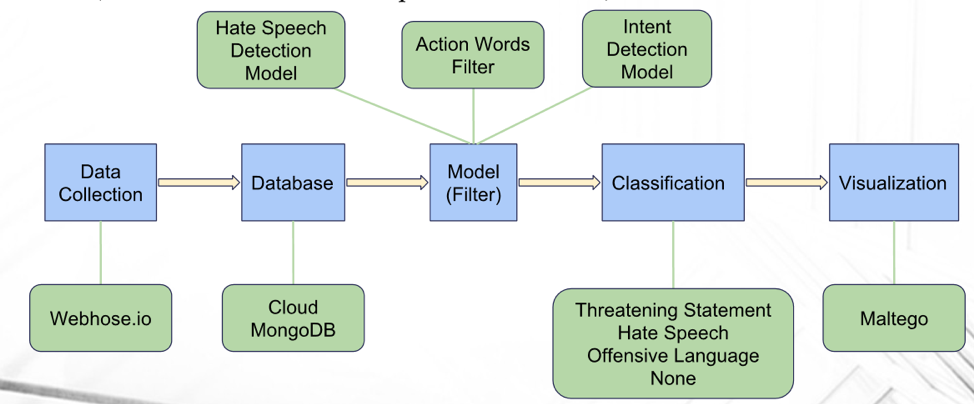
- We are developing an analytics services to classify and visualize people’s opinions via custom internet search.The workflow is first crawling the data from the Internet, where client could define the search terms and data source, and then importing all data into a temporary database. Next, we build models to filter and classify the data queried from database. Finally, we would visualize the results in Maltego Application.
- One topic we are working on is Anti-semitism & Antifa trends across the sites. Customer of Attain is specifically interested in understanding Anti-semitism & Antifa trends across the sites. Since both of these trends can cause violence, customers really want to understand how these trends are developing and whether they are trending toward violent expression. However, typically our customer would conduct research on extremism groups by reading news, blogs or articles from website to website, which might be time-consuming and might make some underlying connections to be overlooked. What Attain wants to do is to look at these groups from a more macro perspective and to provide insights that might be imperceptible when looking from only one aspect.
- To be more specific, we want to figure out the leaders and members in these extremism groups, and the platform that they use to communicate and exchange information within the group. We would also look into major movements they have organized, focusing on their ideology, strategy, plans, and both physical and nonphysical assets. In addition, utilizing social network analysis, we would analyze the relationship between different entities involved to see whether they are concentrated in one area or connected by one specific person or organization.
- Besides, we are also interested in how dangerous these groups are. We would detect and then examine their threat language and also analyze their energy and physical assets to figure out their ability of turning into actual violence so that we could identify risks in advance.
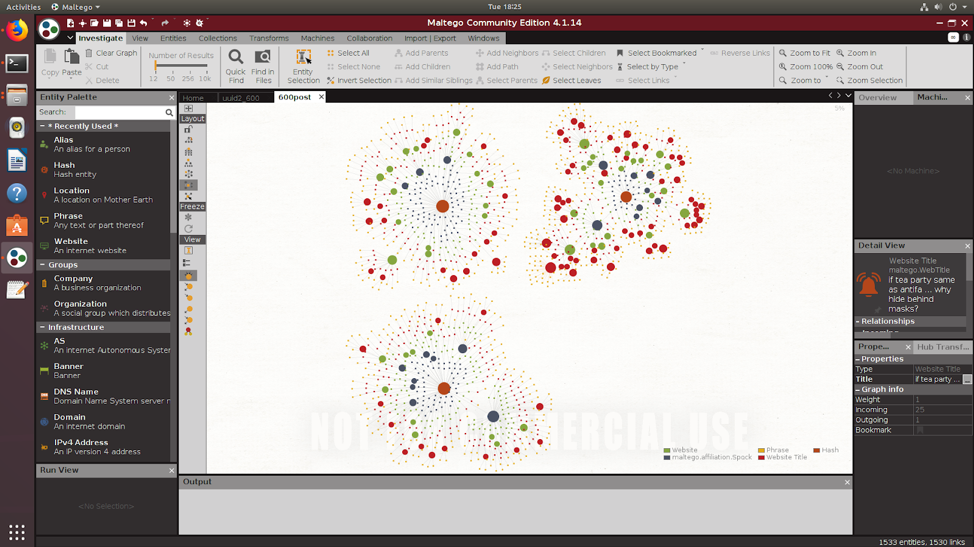
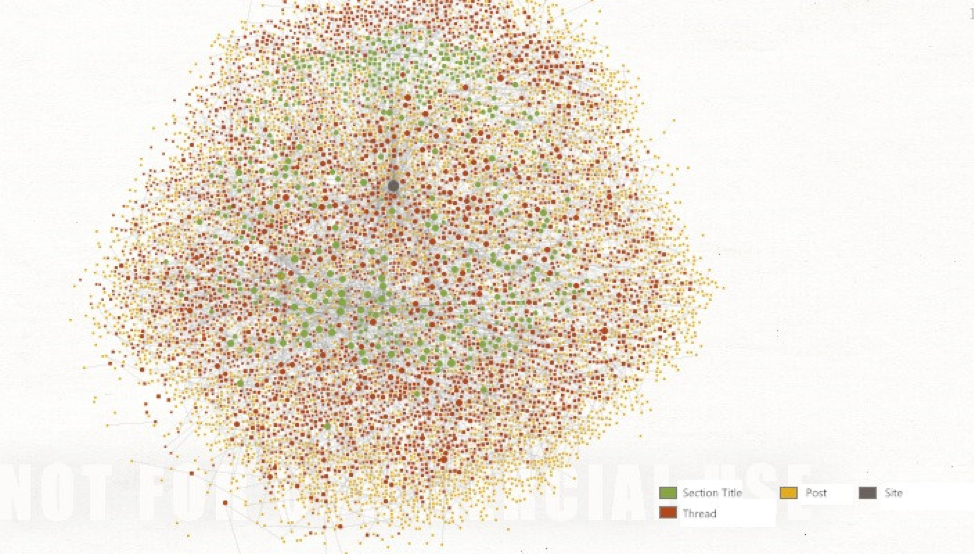
- For the social network analysis platform part, we found a new and easy way to achieve the result which is the visualization of the json data from the Webhose in Maltego. Basically, what we are doing now is using the Local Transforms in Maltego which can transform python scripts to the configuration package that Maltego can use and then visualizing relationships between entities in the way we want. For now, we’ve visualized over 1000 entities and below screenshoot is our newest outcome. In short, three centers of the network are three site types, blogs, news and discussions. Outer nodes are sites like reddit.com, 4chan.org, freerepublic.com, etc. Next level of nodes are section titles under different sites for instance, /pol/ - Politically Incorrect - 4chan, The Donald - America First!, etc. The inferior nodes are different threads under section titles like “Trump Rally”, “MSM blatantly lies about Antifa violently attacking Proud Boys. Skips over the fact that the three arrested were ANTIFA, not Proud Boys.”, etc. The outest nodes are posts under different threads.
*Another topic we are working on is the to understand the risk within Attain. We examined Attain risk data to understand if it is possible to predict recurring risks from the risk factors provided. The risk data we got has the probability, impact and criticality for 8 different projects overtime and each project has the same risk factors such as resources and quality. Here, the criticality equals probability times the impact. We want to see if there is a pattern in the risk data and those risks can be predicted by a model. Therefore, the company can know on which month the risk for the project will increase and be well prepared for those risks.
- Descriptive analysis
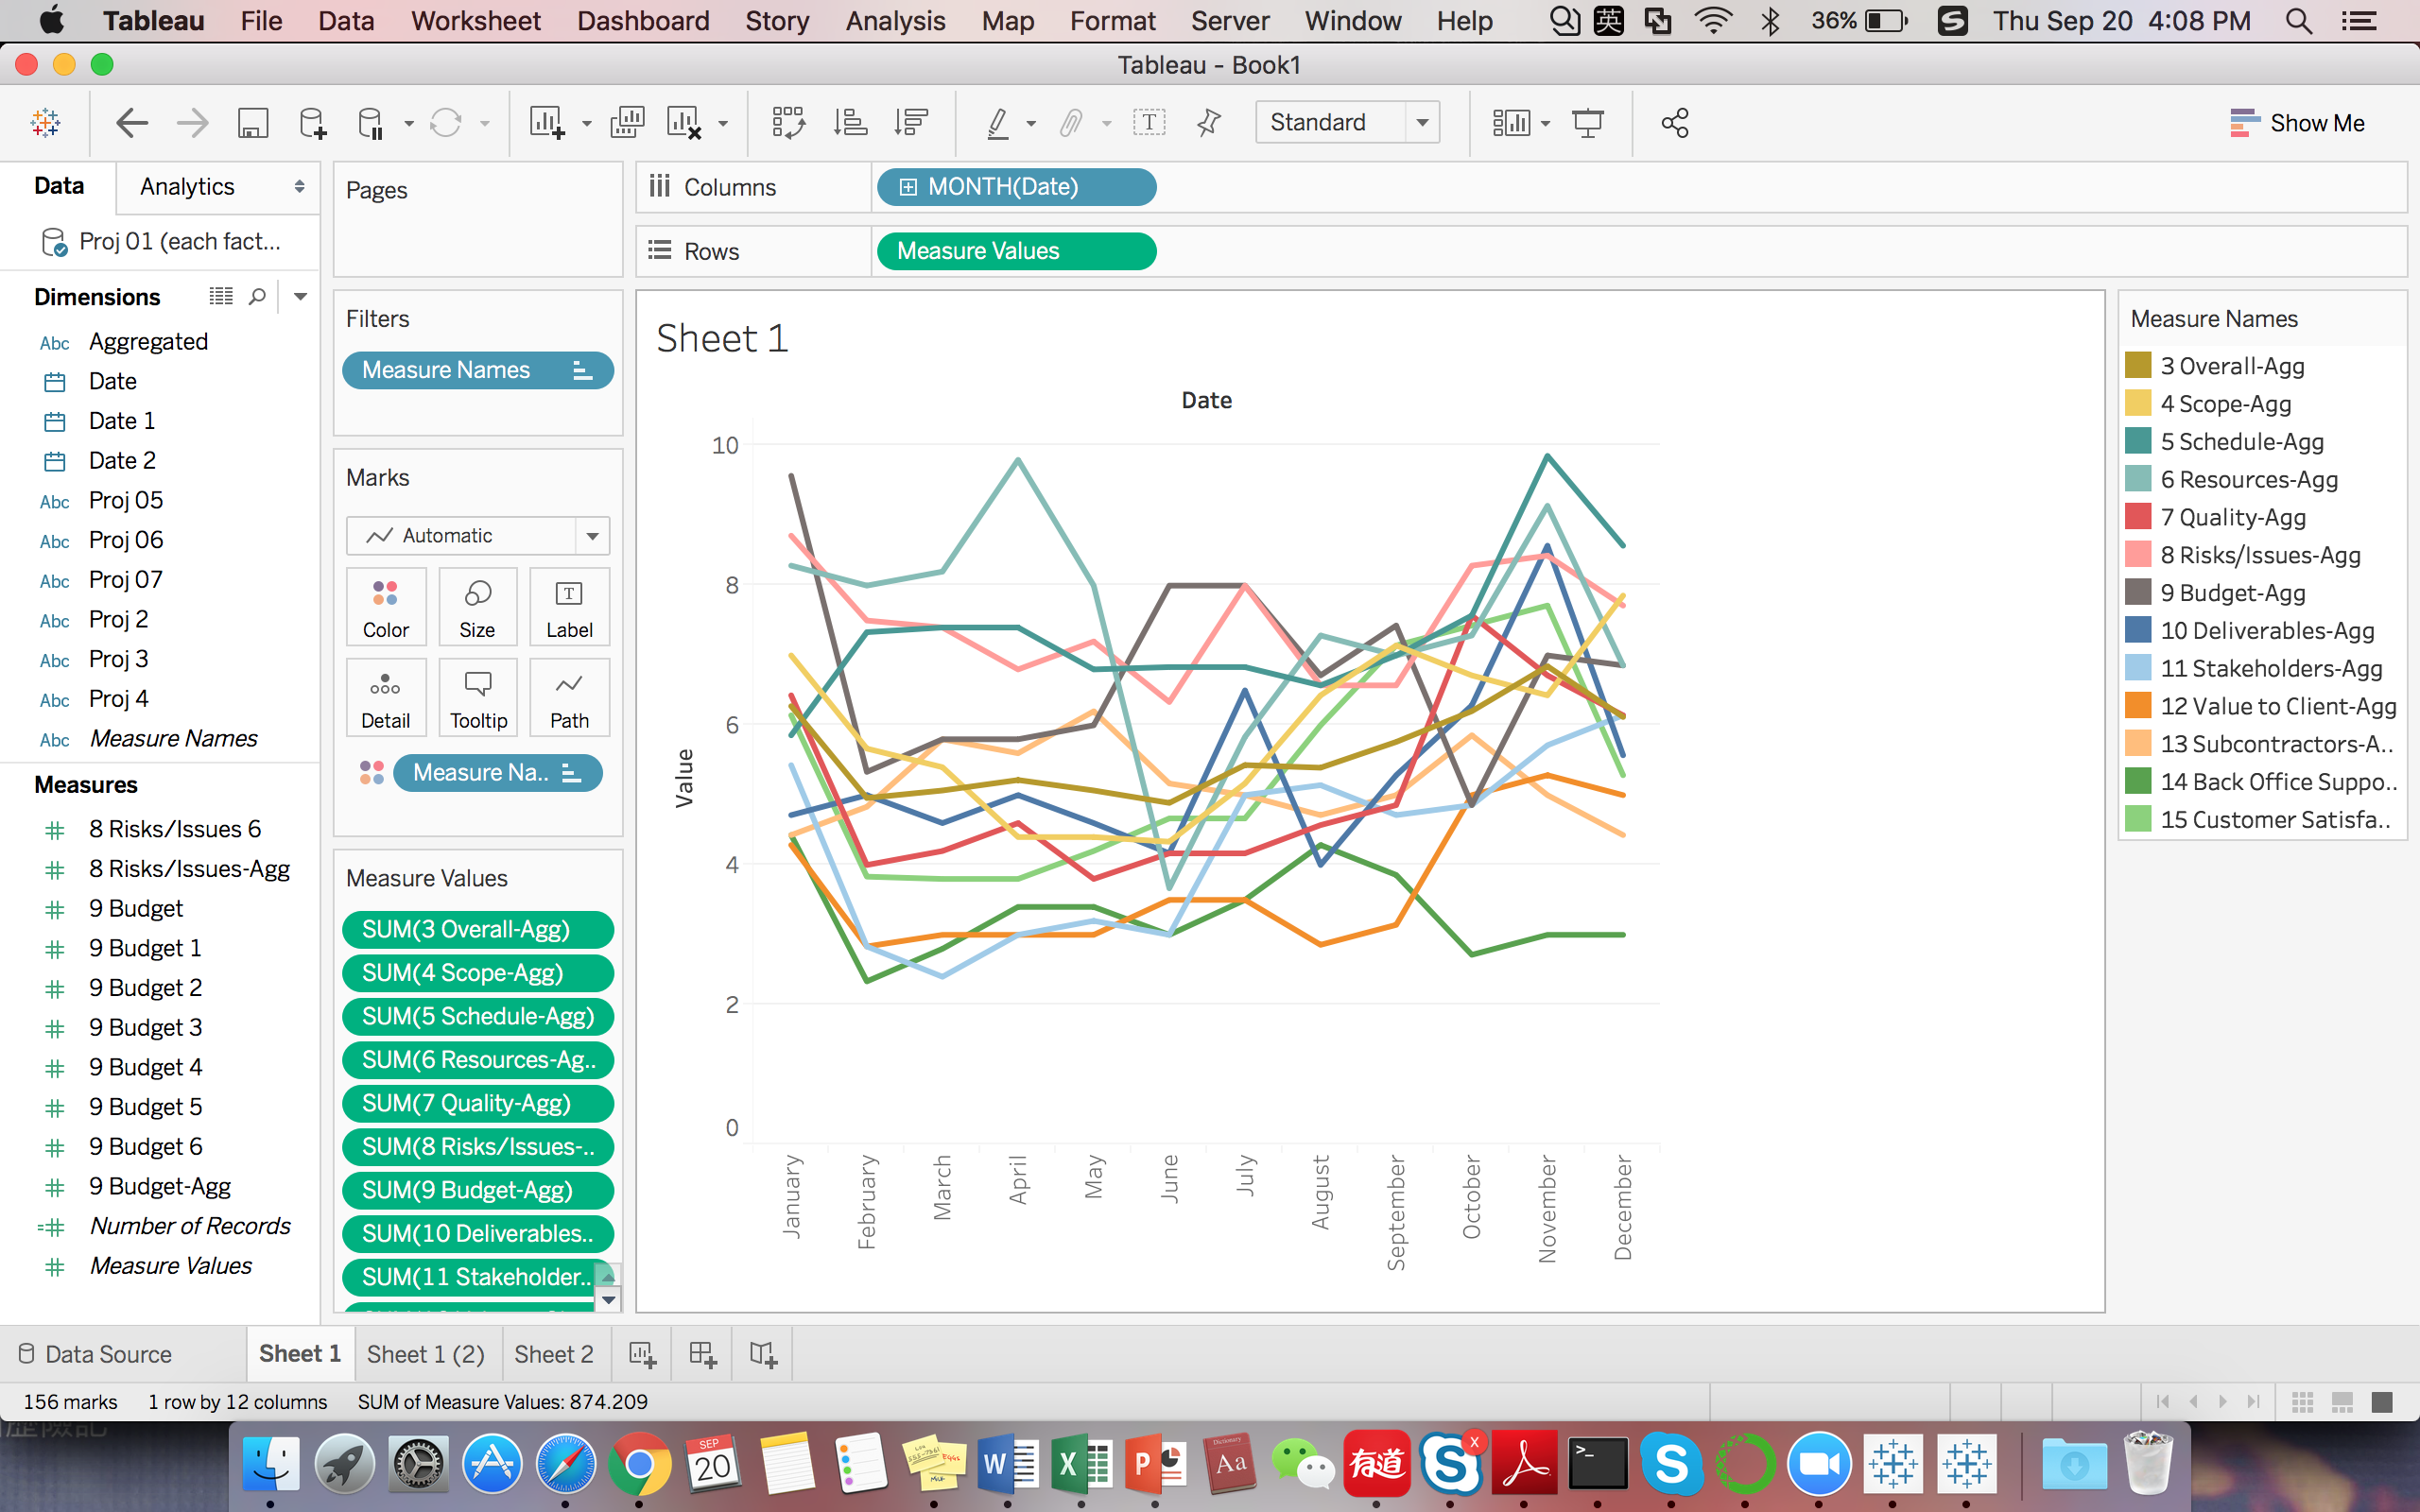
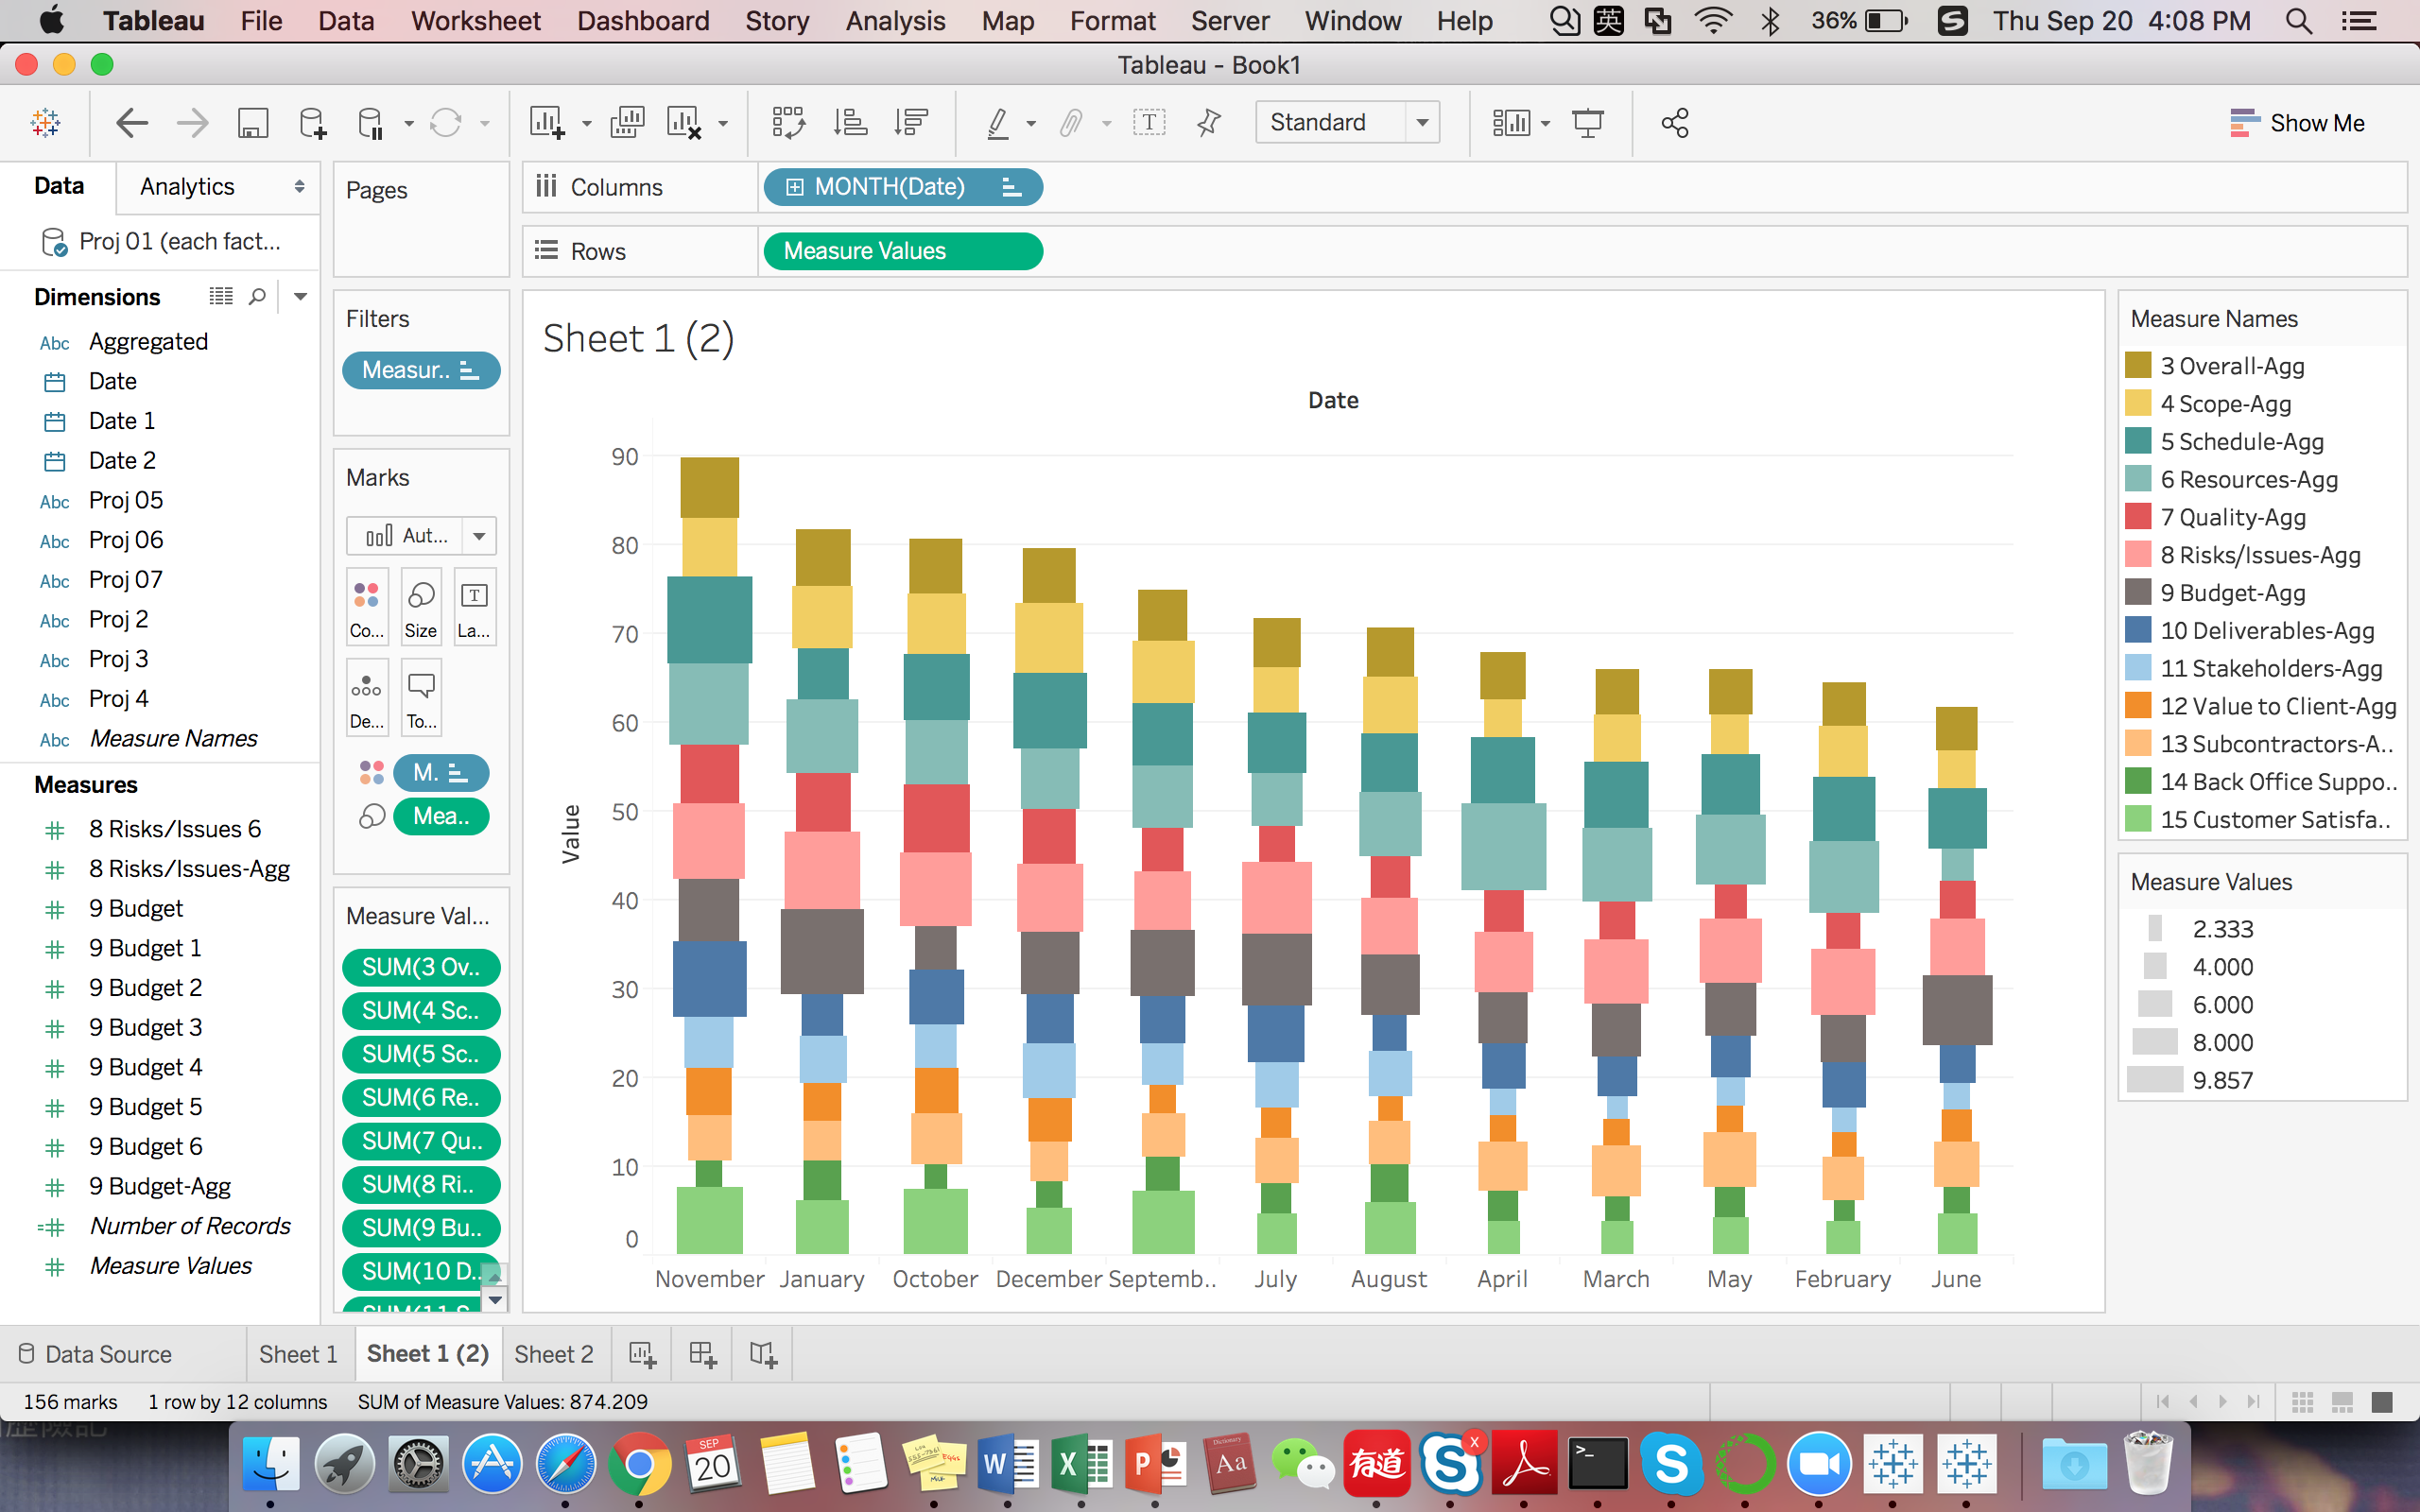
For descriptive analysis, we utilize aggregated values of each factor for plotting trending lines across all months. Specifically, we preprocess average of each factor for every same month across all projects. Then we could see in general the trending fluctuation of each factor overtime. According to the result, we found, in general, project risk getting worse in winter focusing in November, December and January. On the contrary, May, June and Febrary are generally likely to have smooth project going.
Also we would like to show the percentage of each factor accounting for total in every month. So we also visualized aggregated bar plot over time. According to the plot shows, the highest level of criticality is 9.857 and the lowest level of criticality is 2.333. Besides, Budget and Resource are generally the most dangerous factors which we should pay more attention to.
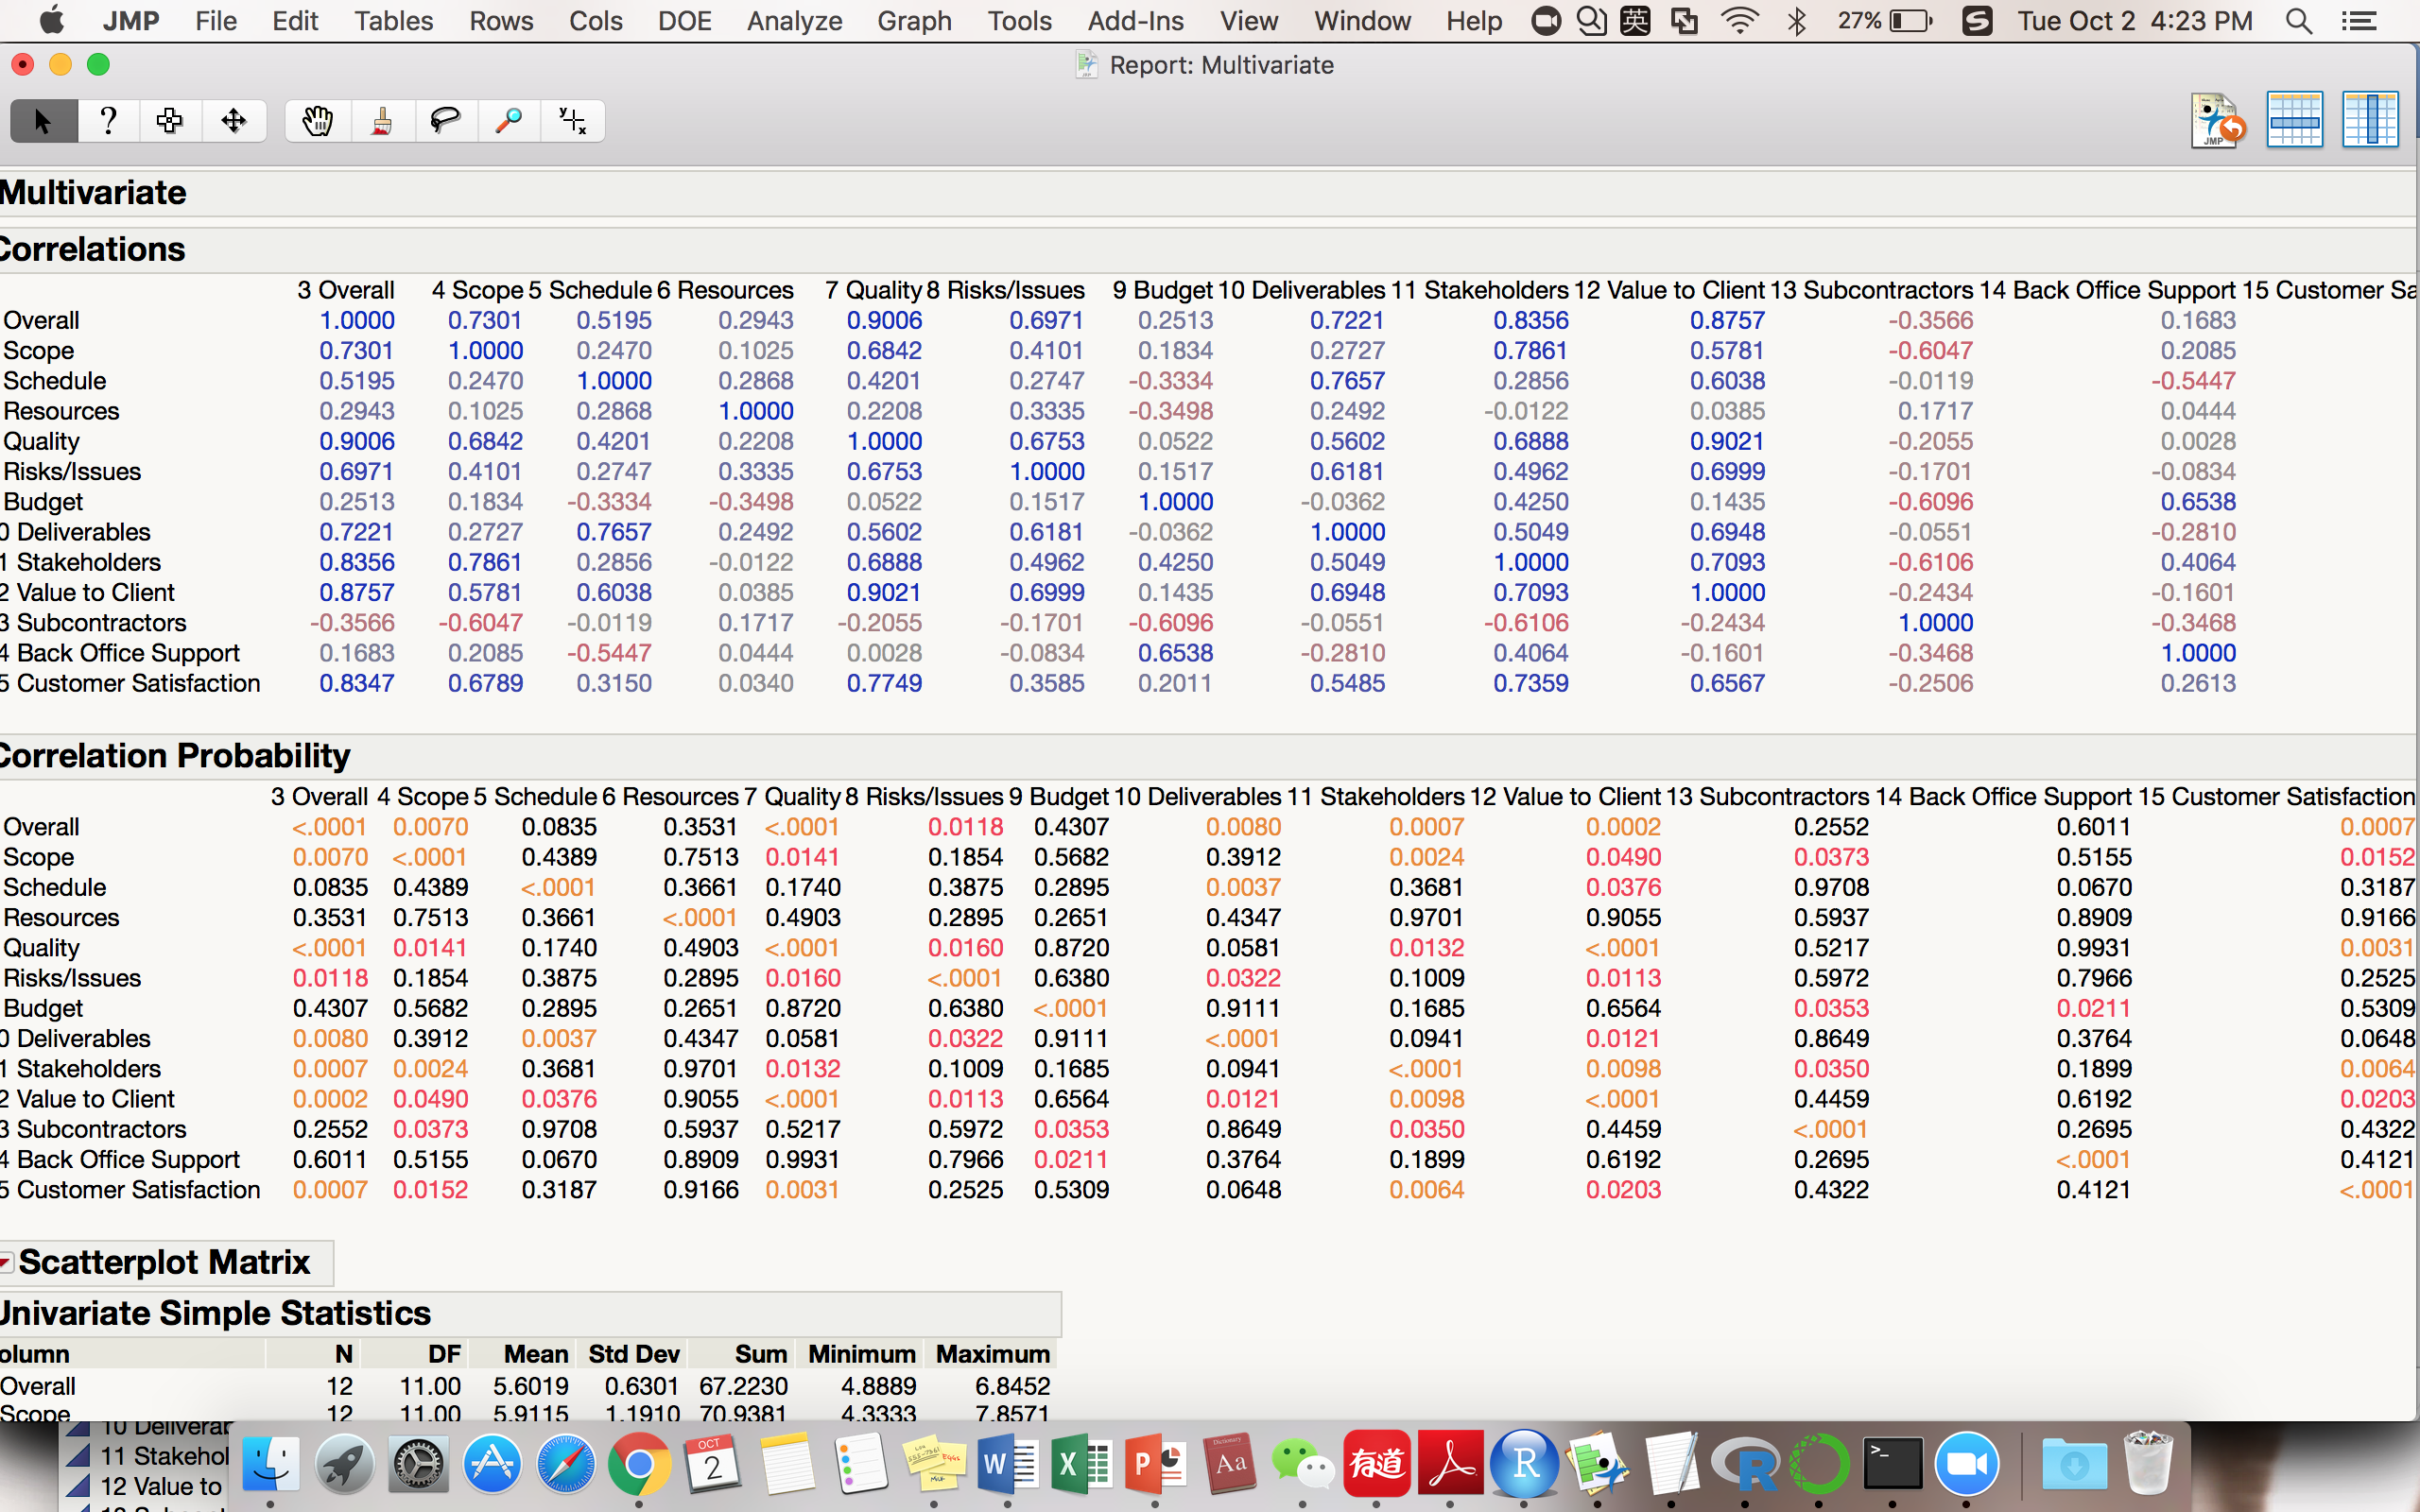
In addition, we are also curious about the multicollinearity of these measure factors. So we also conduct correlation analysis by binary table as well as statistical probability to see how strong of their positive or negative relationships.
- Time Series Predictive Analysis
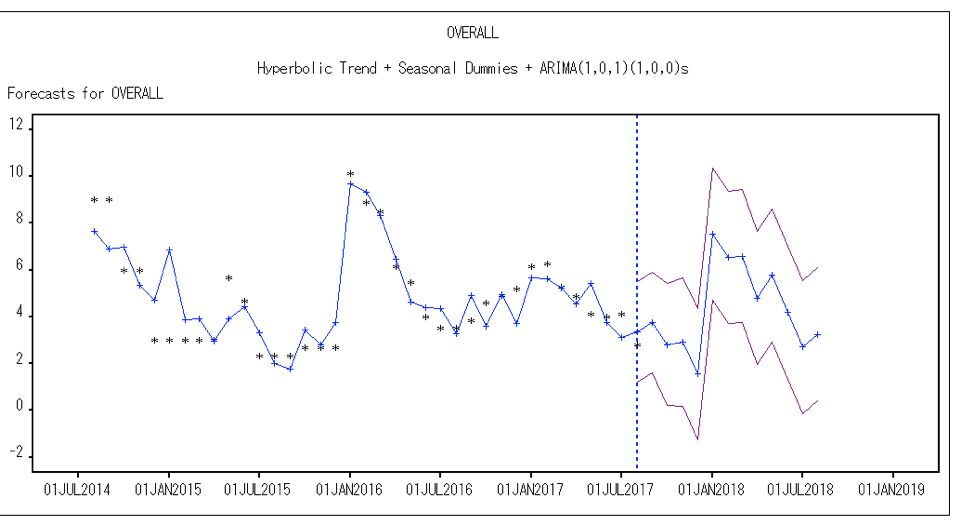
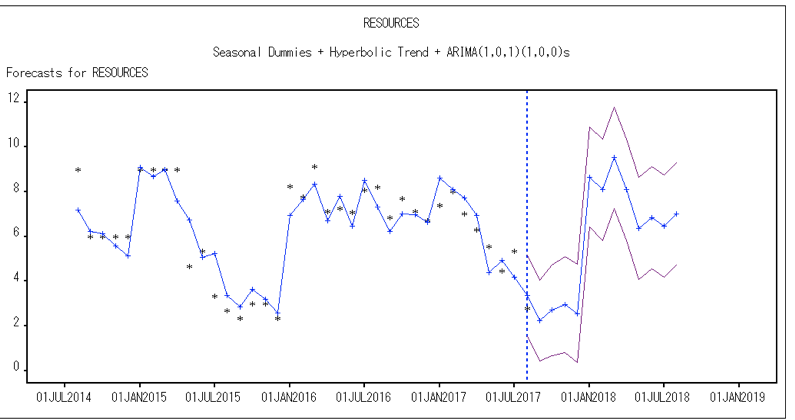
For the risk data, we has the criticality for 8 different projects overtime and each project has the same 13 risk factors such as resources and quality. Last time, we wanted to see if there was a pattern in the risk data and those risks could be predicted by a model. But the time series models for the overall risk and risks for different projects we got had a low R square. Therefore, we made some improvements for the models such as adding seasonal dummies, different kind of trends and ARMA model for seasonals. As we expected, the R square increased a lot, which is more than 0.7. Here are the results from SAS for the overall risk and the resources risk. For example, the resources risk factor, the R Square is even more than 0.8. The R square increased and the error decreased significantly after we use the hyperbolic trend.
- Resume Topic Modelling with LDA model.
With the help of the optimal LDA model, 8 topics from the resume files were concluded and we could demonstrate the words in the 8 topics using wordcloud. The visualizat show the frequency of the words in each topic that we get from the optimal LDA model, which can give us a clear view of the frequency of the words. Here is the output of the wordcloud for the 8 topics respectively.
- Resume Text Classification
As for the resume classification, the convolutional model reached a accuracy of 0.85 after validation. The loss curves and accuracy curves are shown below.
- HAMS (Human Analytics Managed Services)
The gray nodes are sites like “reddit.com”, “4chan.org”, “freerepublic.com”, etc. In this case, the site is only “reddit.com”. Next level of green nodes are section titles (subreddit) under different sites for instance, “STRAYING OUTSIDE OF THE STATUS QUO IS FOR MELVINS”, etc. The red inferior nodes are different threads under section titles like “Centrist conspiracy theorists”, “the meaning of christmas”, etc. The outest yellow nodes are posts under different threads.
- Risk Data
As we expected, the R square increased a lot, which is more than 0.7. Here are the results from SAS for the overall risk and the resources risk. For example, the resources risk factor, R Square is even more than 0.8. The R square increased and the error decreased significantly after we use the hyperbolic trend. With those descriptive analyses and time series models, we can predict the risks for each risk factor and overall factor, which can provide those engagement planners with insightful information when they are executing the projects.
- Platform Improvements
- Improved how consulting services get picked for jobs
- Improved Attain’s ability to understand their workforce and pick the right people for jobs
- Improved Attain’s ability to understand market conditions affecting the job
- Improved Attain’s understanding of which factors drive engagement risk
- Business Improvements
- Better source jobs (services and staff)
- Understand engagement context & risks to avoid
- Leads to more intelligent job execution
.png)
 from all resume data.png)
