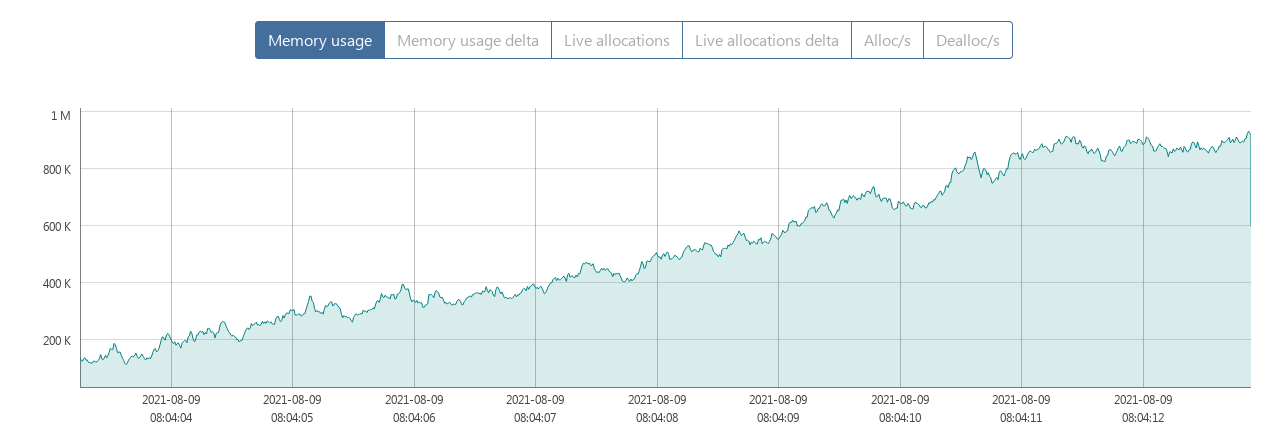
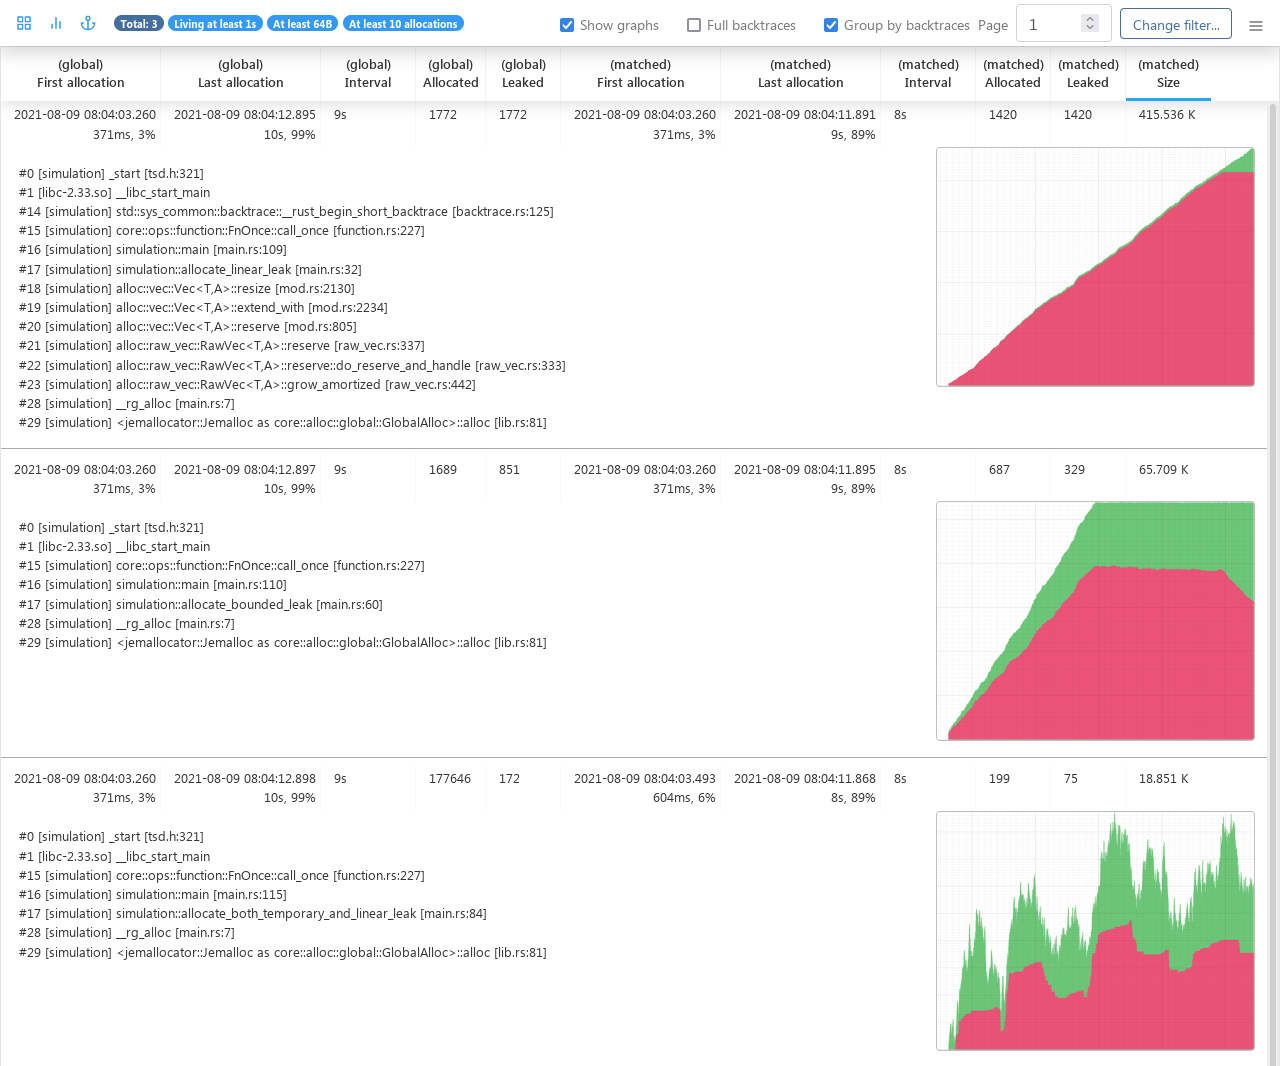
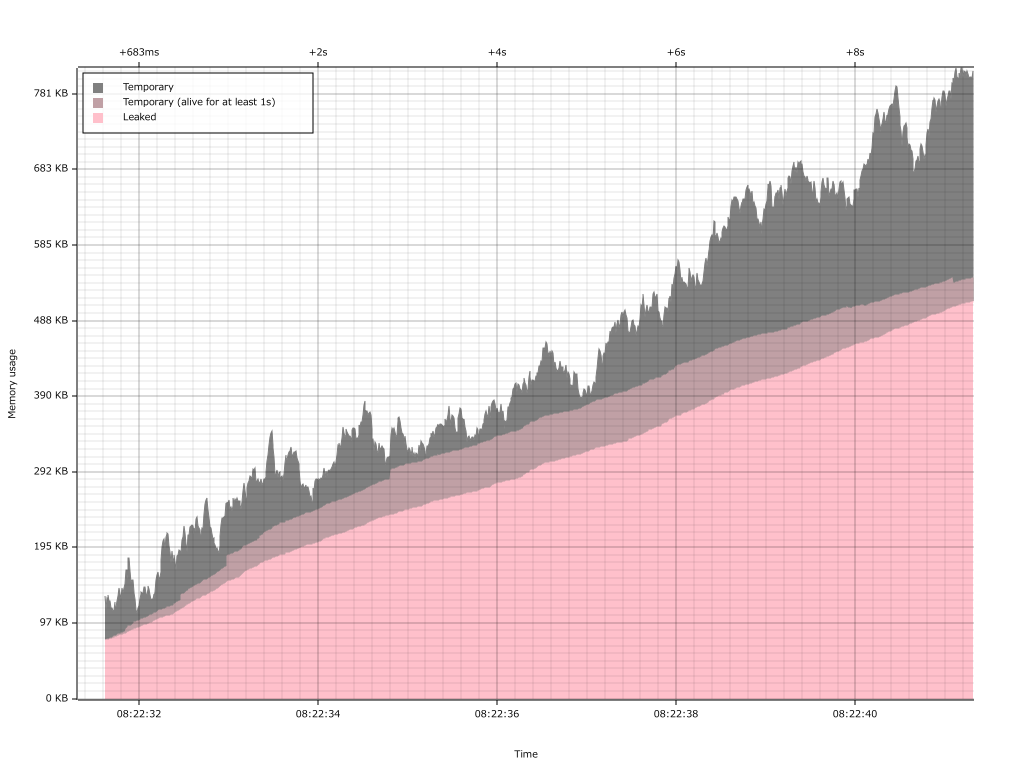
- Can be used to analyze memory leaks, see where exactly the memory is being consumed, identify temporary allocations and investigate excessive memory fragmentation
- Gathers every allocation and deallocation, along with full stack traces
- Can dynamically cull temporary allocations allowing you to profile over a long period of time
- Uses a custom, tailor-made stack unwinding implementation which makes it a lot cheaper than other similar tools, potentially up to orders of magnitude faster in some cases
- Can export the data it gathered into various different formats; it can export the data as JSON (so you can analyze it yourself if you want), as Heaptrack (so you can use the excellent Heaptrack GUI for analysis) and as a flamegraph
- Has its own Web-based GUI which can be used for analysis
- Can dynamically stream the profiling data to another machine instead of saving it locally, which is useful for profiling on memory-constrained systems
- Supports AMD64, ARM, AArch64 and MIPS64 architectures (where MIPS64 requires a tiny out-of-tree kernel patch for
perf_event_open) - Supports profiling of applications which use jemalloc as their allocator (only works on AMD64 with the
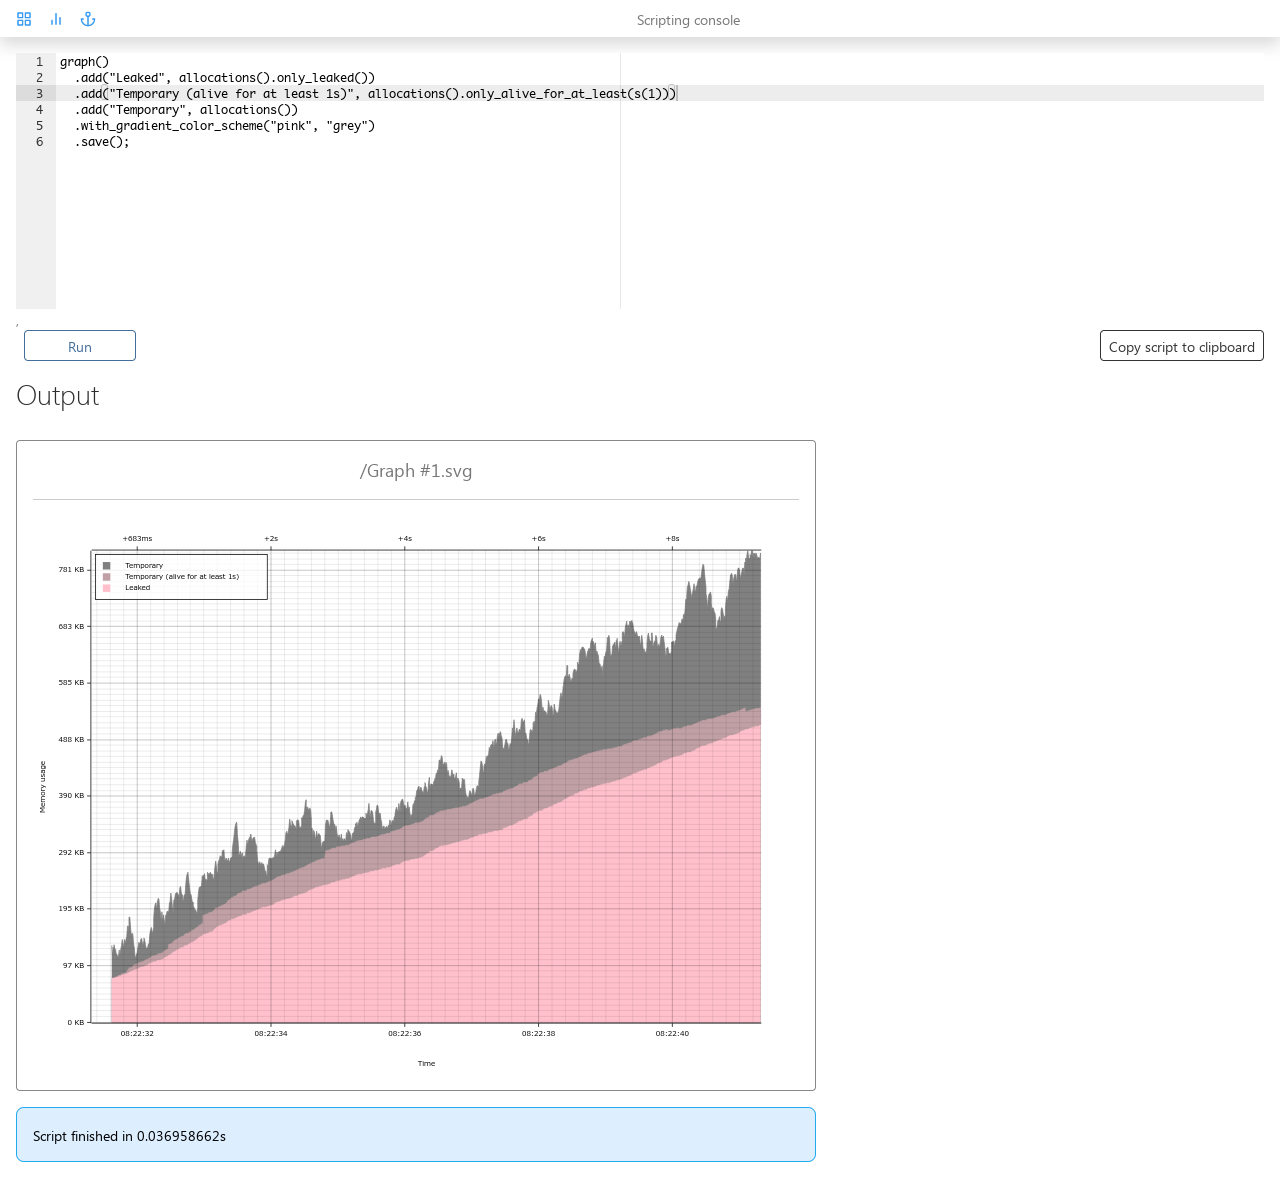
jemallocatorcrate) - Supports an embedded DSL based on Rhai to allow for programmatic and/or automated data analysis
-
Install GCC, Rust nightly and the Yarn package manager (for building the GUI)
-
Build it:
$ cargo build --release -p bytehound-preload $ cargo build --release -p bytehound-cli -
Grab the binaries from
target/release/libbytehound.soandtarget/release/bytehound
$ export MEMORY_PROFILER_LOG=warn
$ LD_PRELOAD=./libbytehound.so ./your_application
$ ./bytehound server memory-profiling_*.dat
Then open your Web browser and point it at http://localhost:8080 to access the GUI.
You can find the full documentation for the profiler in our Memory profiling for fun and profit book.
By default the profiler is compiled with most of its debug logs disabled for performance reasons.
To reenable them be sure to recompile it with the debug-logs feature, e.g. like this:
$ cd preload
$ cargo build --release --features debug-logs
Licensed under either of
- Apache License, Version 2.0, (LICENSE-APACHE or http://www.apache.org/licenses/LICENSE-2.0)
- MIT license (LICENSE-MIT or http://opensource.org/licenses/MIT)
at your option.
Unless you explicitly state otherwise, any contribution intentionally submitted for inclusion in the work by you, as defined in the Apache-2.0 license, shall be dual licensed as above, without any additional terms or conditions.


