The eloverblik component is a Home Assistant custom component for monitoring your electricity data from eloverblik.dk.
The custom component is in its very early stage for showing data from eloverblik.dk.
- Copy
eloverblikfolder into yourcustom_componentsfolder in your HASS configuration directory. - Restart Home Assistant (Settings → ⋮ (the top-right 3-dot menu) → Restart Home Assistant → Restart Home Assistant → Restart).
- Configure Eloverblik through Settings → Devices & Services → Add Integration.
- Ensure that HACS is installed.
- Search for and install the
eloverblikintegration through HACS. - Restart Home Assistant (Settings → ⋮ (the top-right 3-dot menu) → Restart Home Assistant → Restart Home Assistant → Restart).
- Configure Eloverblik through Settings → Devices & Services → Add Integration.
Get the refresh token and the metering point from eloverblik.dk.
- Log in to Eloverblik.
- Metering point ID is used for
IDin Home Assistant. - Create a refresh token.
- Click your user.
- Chose Data Sharing.
- Click Create token and go trough the steps setting your preferences.
A sensor for each over hour in the past 24 hours is created with the syntax:
sensor.eloverblik_energy_0_1sensor.eloverblik_energy_1_2- etc.
A sensor which sum up the total energy usage is added as well:
sensor.eloverblik_energy_total
All sensors show their value in kWh.
It is possible to debug log the raw response from eloverblik.dk API. This is done by setting up logging like below in configuration.yaml in Home Assistant. It is also possible to set the log level through a service call in UI.
logger:
  default: info
  logs:
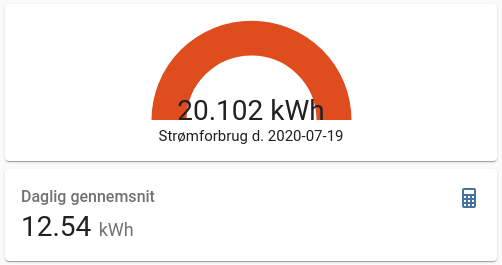
pyeloverblik.eloverblik: debugBelow example is an example how to display daily average and a guage indicating high usage.
Requirements
- Recorder component holding minimum the number of days the average display should cover.
- Lovelace Config Template Card (https://github.com/iantrich/config-template-card)
Average sensor
Below statistics sensor shows the daily average calculated over the last 30 days.
sensor:
  - platform: statistics
    entity_id: sensor.eloverblik_energy_total
    name: Eloverblik Monthly Statistics
    sampling_size: 50
    state_characteristic: mean
    max_age:
        days: 30
Lovelace
type: vertical-stack
cards:
  - card:
      entity: sensor.eloverblik_energy_total
      max: 20
      min: 0
      name: >-
        ${'Strømforbrug d. ' +
        states['sensor.eloverblik_energy_total'].attributes.metering_date }
      severity:
        green: 0
        red: '${states[''sensor.eloverblik_monthly_statistics''].state * 1.25}'
        yellow: '${states[''sensor.eloverblik_monthly_statistics''].state * 1.10}'
      type: gauge
    entities:
      - sensor.eloverblik_energy_total
      - sensor.eloverblik_monthly_statistics
    type: 'custom:config-template-card'
  - type: entity
    entity: sensor.eloverblik_monthly_statistics
    name: Daglig gennemsnit
If you have the Nordpool installed you can calculate the current electricity price and forecast the price for today and tomorrow by the hour. These prices will including any tarrifs that apply, which will adjust according to peak times and season as they are fetched from Eloverblik. This way you will get the actual price you pay per kWh. You can plot this on a dashboard, or use it in the Energy dashboard.
To combine the the nordpool and eloverblik sensors, create below template sensor. Please note that the template assumes that your nordpool integration is configuerd to NOT include VAT.
template:
  - sensor:
    - name: "Electricity Cost"
      unique_id: electricity_cost
      device_class: monetary
      unit_of_measurement: "kr/kWh"
      state: >
        {{ 1.25 * (float(states('sensor.eloverblik_tariff_sum')) + float(states('sensor.nordpool'))) }}
      attributes:
        today: >
          {% if state_attr('sensor.eloverblik_tariff_sum', 'hourly') and state_attr('sensor.nordpool', 'today') %}
            {% set ns = namespace (prices=[]) %}
            {% for h in range(24) %}
              {% set ns.prices = ns.prices + [(1.25 * (float(state_attr('sensor.eloverblik_tariff_sum', 'hourly')[h]) + float(state_attr('sensor.nordpool', 'today')[h]))) | round(5)] %}
            {% endfor %}
            {{ ns.prices }}
          {% endif %}
        tomorrow: >
          {% if state_attr('sensor.eloverblik_tariff_sum', 'hourly') and state_attr('sensor.nordpool', 'tomorrow') %}
            {% set ns = namespace (prices=[]) %}
            {% for h in range(24) %}
              {% set ns.prices = ns.prices + [(1.25 * (float(state_attr('sensor.eloverblik_tariff_sum', 'hourly')[h]) + float(state_attr('sensor.nordpool', 'tomorrow')[h]))) | round(5)] %}
            {% endfor %}
            {{ ns.prices }}
          {% endif %}
Replace nordpool with the name of your Nordpool sensor.
The integration now supports long-term statistics and energy dashboard.
The integration will pull current and last years data from Eloverblik and insert it into the long-term statistics in HomeAssistant.
An entity with the id sensor.eloverblik_energy_statistic is created,
this entity will always have an unknown value, since if a current value is set,
the recorder will try to write it to the statistics.
NOTE: This is not the ideal setup, but it does enable owners that do not have live access to their measurements to get the data into home-assitant.
But the entity will have a valid long-term statistic.
The statistic will continually be updateed daily.
NOTE: The data will be delayed between 1 and 3 days, depending on your local grid operator (DSO).
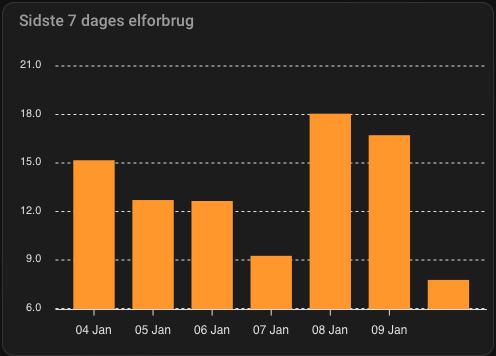
Below are two examples of UI yaml configuration to display the values.
type: statistic
name: Elforbrug i går
entity: sensor.eloverblik_energy_statistic
period:
  calendar:
    period: day
    offset: -1
stat_type: change
icon: mdi:lightning-boltThis is created with the help of apexcharts
type: custom:apexcharts-card
graph_span: 7d
header:
  show: true
  title: Sidste 7 dages elforbrug
span:
  end: day
  offset: '-1d'
series:
  - entity: sensor.eloverblik_energy_statistic
    type: column
    statistics:
      type: sum
      period: hour
    group_by:
      func: diff
      start_with_last: true
      duration: 1d


