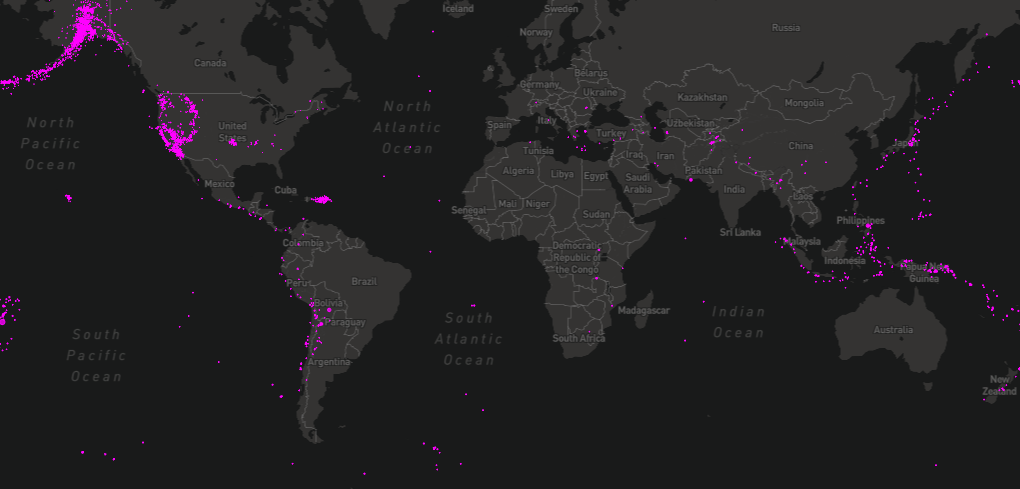
A little project demo I put together that visually plots earthquakes using data from USGS
- JavaScript
- P5.js
- REST API's
- Mapbox API
- implement basic functionality
- add full screen functionality and "reponsiveness"
- optimize for mobile
- add refresh button
- add timelapse functionality
- implement backend to store past data
- enable clicking of earthquakes for more info
- implement deep learning to predict future earthquakes
- add in your own API Key file sketch.js file
- It should look something like this:
mapimg = loadImage("https://api.mapbox.com/styles/v1/mapbox/dark-v9/static/" + clat + "," + clon + "," + zoom + ",0,0/" + mapWidth + "x" + mapWidth + "?access_token=" + LOOKITSMYKEY);- Grab an api key here:
- Thats it.......it's really that easy
