An image display GUI for Julia.
To install the ImageView package:
Pkg.add("ImageView")First let's try it with a photograph. If you have an image on your computer, load it this way:
using ImageView, Images
img = load("my_photo.jpg")
Any typical image format should be fine, it doesn't have to be a jpg. The TestImages package contains several standard images:
using TestImages
img = testimage("mandrill")For simplicity, you should first test ImageView at the REPL prompt or in an IDE; script usage is discussed later below.
You can view the image using imshow:
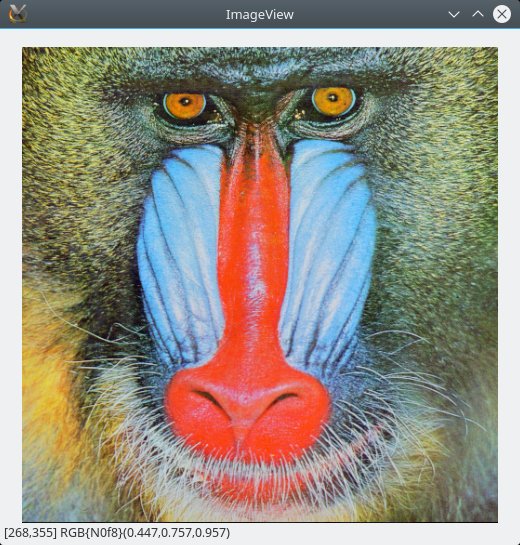
imshow(img)You should get a window with your image:
You can use imshow() if you want to choose an image using a file
dialog.
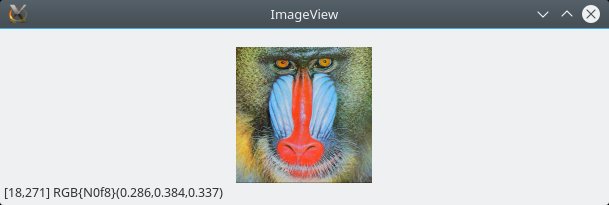
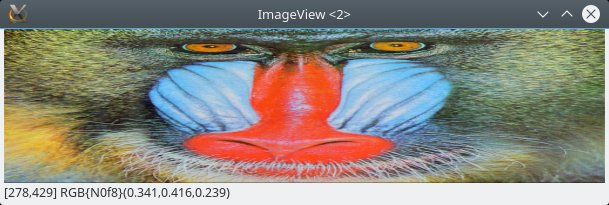
Try resizing the image window by dragging one of its corners; you'll
see that the aspect ratio of the image is preserved when you
resize. If instead you want the image to fill the pane, try
imshow(img, aspect=:none). Here's a comparison of the two:
| aspect=:auto (default) | aspect=:none |
|---|---|
 |
 |
Next, Ctrl-click and drag somewhere inside the image. You'll see the typical rubberband selection, and once you let go the image display will zoom in on the selected region. Again, the aspect ratio of the display is preserved. If you click on the image without holding down Ctrl, you can drag the image to look at nearby regions. Ctrl-double-click on the image to restore the full region.
If you have a wheel mouse, zoom in again and scroll the wheel, which should cause the image to pan vertically. If you scroll while holding down Shift, it pans horizontally; hold down Ctrl and you affect the zoom setting. Note as you zoom via the mouse, the zoom stays focused around the mouse pointer location, making it easy to zoom in on some small feature simply by pointing your mouse at it and then Ctrl-scrolling.
You can view the image upside-down with
imshow(img, flipy=true)(flipx flips the image horizontally) or switch the horizontal and vertical axes with
imshow(img, axes=(2,1)).The window can be closed using Ctrl-W (use Cmd-W on a Mac). All windows opened by ImageView can be closed using Ctrl-Shift-W (Cmd-Shift-W on a Mac). Fullscreen can be toggled using F11 (on Linux or Windows, use Cmd-Shift-F on a Mac).
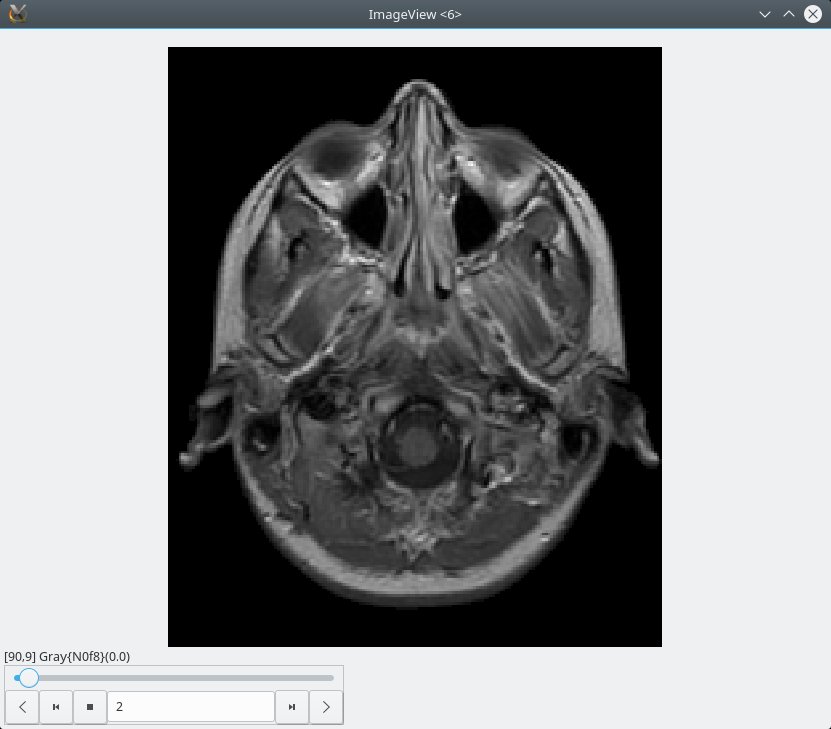
For movies, 3D, and 4D images, ImageView will create a "player" widget.
img = testimage("mri")
imshow(img)
The "mri" image is an AxisArray, and consequently you can select axes by name:
imshow(img, axes=(:S, :P), flipy=true) # a sagittal plane (Superior, Posterior)imshow(img) |
imshow(img, axes=(:S, :P), flipy=true) |
|---|---|
 |
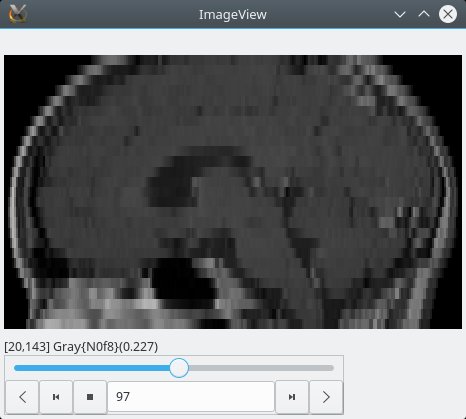 |
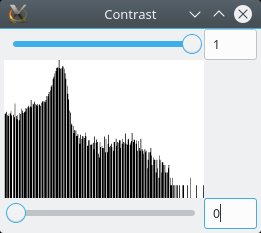
Finally, right-clicking on the image yields context menu that allows you to save the image shown in the viewer (including annotations) to a PNG file or to the clipboard, and a brightness/contrast GUI:
You can adjust the contrast by adjusting the sliders or by entering values into the text boxes.
ImageView.closeall() closes all open windows.
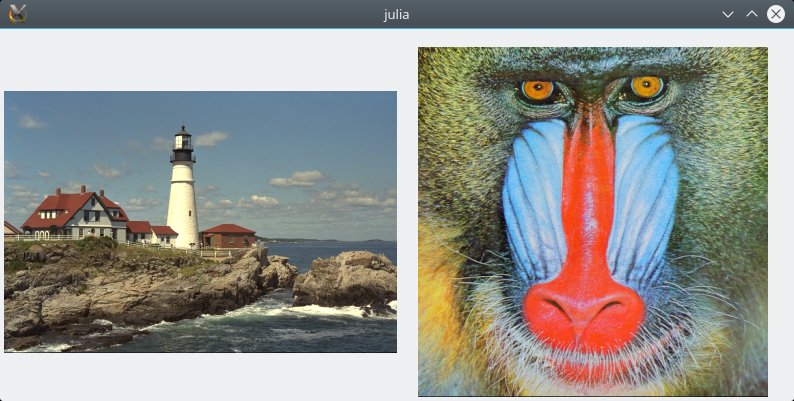
You can place multiple images in the same window using imshow_gui:
using ImageView, TestImages, Gtk4
gui = imshow_gui((300, 300), (2, 1))  # 2 columns, 1 row of images (each initially 300×300)
canvases = gui["canvas"]
imshow(canvases[1,1], testimage("lighthouse"))
imshow(canvases[1,2], testimage("mandrill"))
show(gui["window"])
gui["window"] returns the window; gui["canvas"] either returns a single canvas
(if there is just one), or an array if you've specified a grid of canvases.
Gtk4.show(win) is sometimes needed when using the lower-level utilities of this
package. Generally you should call it after you've finished assembling the entire window,
so as to avoid redraws with each subsequent change.
imshow returns a dictionary containing a wealth of information about
the state of the viewer. Perhaps most interesting is the "roi"
entry, which itself is another dictionary containing information about
the current selected region or interest. These are
Observables signals, and consequently you can even manipulate the
state of the GUI by push!ing new values to these signals.
For example, using the "mri" image above, you can select the 5th slice with
guidict = imshow(img)
guidict["roi"]["slicedata"].signals[1][] = 5
SliceData objects contain information about which axes are displayed
and the current slice indices of those axes perpendicular to the view
plane. Likewise, "image roi" contains the actual image data
currently being shown in the window (including all zoom/slice
settings).
The "zoom"- and "pan"-related signals originate from
GtkObservables,
and users should see the documentation for that package for more
information.
imshow allows you to pass many more arguments; please use ?imshow
to see some of the options. We can use these extra arguments to couple
the zoom and slice regions between two images. Let's make a "fake" image encoding the segmentation of an image:
using ImageView, GtkObservables, TestImages, Images

# Prepare the data
mri = testimage("mri")
mriseg = RGB.(mri)
mriseg[mri .> 0.5] .= colorant"red"
Now we display the images:
guidata = imshow(mri, axes=(1,2))
zr = guidata["roi"]["zoomregion"]
slicedata = guidata["roi"]["slicedata"]
imshow(mriseg, nothing, zr, slicedata)
Here we used imshow to create the first window, and then extracted
the zoomregion and slicedata information from that display and
used them to initialize a second window with the second image. If you
zoom, pan, or change the slice plane in one window, it makes the same
change in the other.
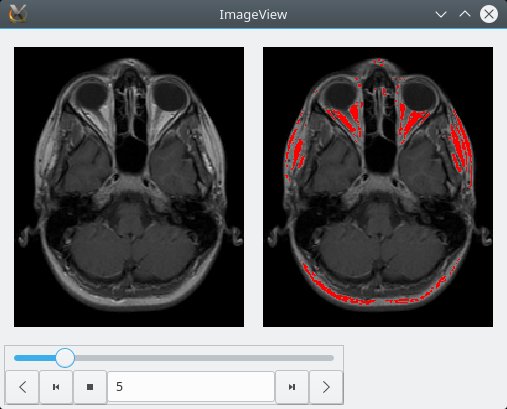
Alternatively, you can place both displays in a single window:
zr, slicedata = roi(mri, (1,2))
gd = imshow_gui((200, 200), (1,2); slicedata=slicedata)
imshow(gd["frame"][1,1], gd["canvas"][1,1], mri, nothing, zr, slicedata)
imshow(gd["frame"][1,2], gd["canvas"][1,2], mriseg, nothing, zr, slicedata)
You should see something like this:
You can add and remove various annotations to images (currently text, points, and lines). There are two basic styles of annotation: "anchored" and "floating." An "anchored" annotation is positioned at a particular pixel location within the image; if you zoom or pan, the annotation will move with the image, and may not even be shown if the corresponding position is off-screen. In contrast, a "floating" annotation is not tied to a particular location in the image, and will always be displayed at approximately the same position within the window even if you zoom or pan. As a consequence, "anchored" annotations are best for labeling particular features in the image, and "floating" annotations are best for things like scalebars.
Here's an example of adding a 30-pixel scale bar to an image:
guidict = imshow(img)
scalebar(guidict, 30; x = 0.1, y = 0.05)
x and y describe the center of the scale bar in normalized
coordinates, with (0,0) in the upper left. In this example, the
length of the scale bar is in pixels, but if you're using the
Unitful package for the
image's pixelspacing, then you should set the length to something
like 50μm.
The remaining examples are for fixed annotations. Here is a demonstration:
using Images, ImageView
z = ones(10,50);
y = 8; x = 2;
z[y,x] = 0
guidict = imshow(z)
idx = annotate!(guidict, AnnotationText(x, y, "x", color=RGB(0,0,1), fontsize=3))
idx2 = annotate!(guidict, AnnotationPoint(x+10, y, shape='.', size=4, color=RGB(1,0,0)))
idx3 = annotate!(guidict, AnnotationPoint(x+20, y-6, shape='.', size=1, color=RGB(1,0,0), linecolor=RGB(0,0,0), scale=true))
idx4 = annotate!(guidict, AnnotationLine(x+10, y, x+20, y-6, linewidth=2, color=RGB(0,1,0)))
idx5 = annotate!(guidict, AnnotationBox(x+10, y, x+20, y-6, linewidth=2, color=RGB(0,0,1)))
# This shows that you can remove annotations, too:
delete!(guidict, idx)
This is what this looks like before delete!ing the first annotation:
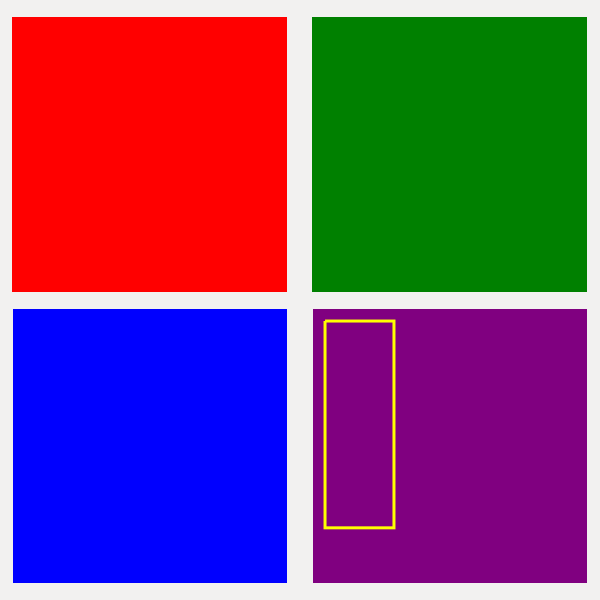
If you have a grid of images, then each image needs its own set of annotations, initialized
by calling annotations():
using ImageView, Images, Gtk4
# Create the window and a 2x2 grid of canvases, each 300x300 pixels in size
gui = imshow_gui((300, 300), (2, 2))
canvases = gui["canvas"]
# Create some single-color images (just for testing purposes)
makeimage(color) = fill(color, 100, 100)
imgs = makeimage.([colorant"red" colorant"green";
                   colorant"blue" colorant"purple"])
# Create empty annotations structures for each canvas
anns = [annotations() annotations();
        annotations() annotations()]
# Draw the images on the canvases. Note that we supply the annotation object for each.
roidict = [imshow(canvases[1,1], imgs[1,1], anns[1,1]) imshow(canvases[1,2], imgs[1,2], anns[1,2]);
           imshow(canvases[2,1], imgs[2,1], anns[2,1]) imshow(canvases[2,2], imgs[2,2], anns[2,2])]
# Now we'll add an annotation to the lower-right image
annotate!(anns[2,2], canvases[2,2], roidict[2,2], AnnotationBox(5, 5, 30, 80, linewidth=3, color=RGB(1,1,0)))AnnotationText(x, y, str;
z = NaN, t = NaN,
color = RGB(0,0,0), angle = 0.0, fontfamily = "sans", fontsize = 10,
fontoptions = "", halign = "center", valign = "center", markup = false, scale=true)
Place str at position (x,y).
Properties:
z- position on z axis, for 3D imagest- position on time axis, for movie-like imagescoloranglefontfamilyfontsize- font size in pointsfontoptionshalign- "center", "left", or "right"valign- "center", "top", or "bottom"markupscale- scale the text as the image is zoomed (default:true)
AnnotationPoints([xy | xys | x, y];
                 z = NaN, t = NaN, size=10.0, shape::Char='x',
                 color = RGB(1,1,1), linewidth=1.0, linecolor=color, scale::Bool=false)
Annotate the point xy, (x,y), or the points xys. xys maybe a Vector of tuples Vector{(Real,Real)}, or a 2 x N Matrix. Points are assumed to be in (x,y) order. (TODO: this could be generalized, as with lines.)
Properties:
z- position on z axis, for 3D imagest- position on time axis, for movie-like imagessize- how large to draw the pointshape- one of'.','x','o','+','*'colorlinewidth- width of lines used to draw the pointlinecolor- line color; defaults tocolor; filled circles (shape='.') can have a different outline and fill colorscale- scale the drawn size of the point when the image is scaled (default:false)
AnnotationLines(line | lines | c1,c2,c3,c4;
                z = NaN, t = NaN,
                color = RGB(1,1,1), linewidth=1.0, coord_order="xyxy")
Draw line, lines, or the line with coordinates (c1,c2,c3,c4). line is specified as a tuple of point tuples, ((x1,y1),(x2,y2)). lines may be a Vector of such lines, or a 4 x N matrix. For a matrix or when specifying coordinates independently, the coordinate order is specified by coord_order, which defaults to "xyxy".
Properties:
z- position on z axis, for 3D imagest- position on time axis, for movie-like imagescolorlinewidth- width of the line(s)coord_order- for matrix or coordinate inputs, the order of the coordinates (e.g., "xyxy", "xxyy", "yyxx")
AnnotationBox(left, top, right, bottom | (x1,y1), (x2,y2) | bb::Graphics.BoundingBox;
              z = NaN, t = NaN,
              color = RGB(1,1,1), linewidth=1.0, coord_order="xyxy")
Draw a box. Box can be specified using four values for (left, top, right, bottom), as a pair of tuples, (x1,y1),(x2,y2), or as a BoundingBox. The coordinate order the pair of tuples may be specified by coord_order, which defaults to "xyxy".
Properties:
z- position on z axis, for 3D imagest- position on time axis, for movie-like imagescolorlinewidth- width of the lines
If you call Julia from a script file, the GLib main loop (which is responsible for handling events like mouse clicks, etc.) will not start automatically, and the julia process will terminate at the end of the program. This will cause any windows opened with imshow() to terminate, which is probably not what you intend. We want to start the main loop and then make it only terminate the process when the image window is closed. Below is some example code to do this:
using Images, ImageView, TestImages, Gtk4

img = testimage("mandrill")
guidict = imshow(img);

#If we are not in a REPL
if (!isinteractive())

    # Create a condition object
    c = Condition()

    # Get the window
    win = guidict["gui"]["window"]

    # Start the GLib main loop
    @async Gtk4.GLib.glib_main()

    # Notify the condition object when the window closes
    signal_connect(win, :close_request) do widget
        notify(c)
    end

    # Wait for the notification before proceeding ...
    wait(c)
end
This will prevent the julia process from terminating immediately. Note
that if we did not call signal_connect, the process will keep
waiting even after the image window has closed, and you will have to
manually close it with CTRL + C.
If you are opening more than one window you will need to create more
than one Condition object, if you wish to wait until the last one is
closed. See
(here)[https://juliagtk.github.io/Gtk4.jl/dev/howto/nonreplusage/] for
more information.
