Making graphs you can play with
from any
Zotero library..
website : libviz.artlabo.org
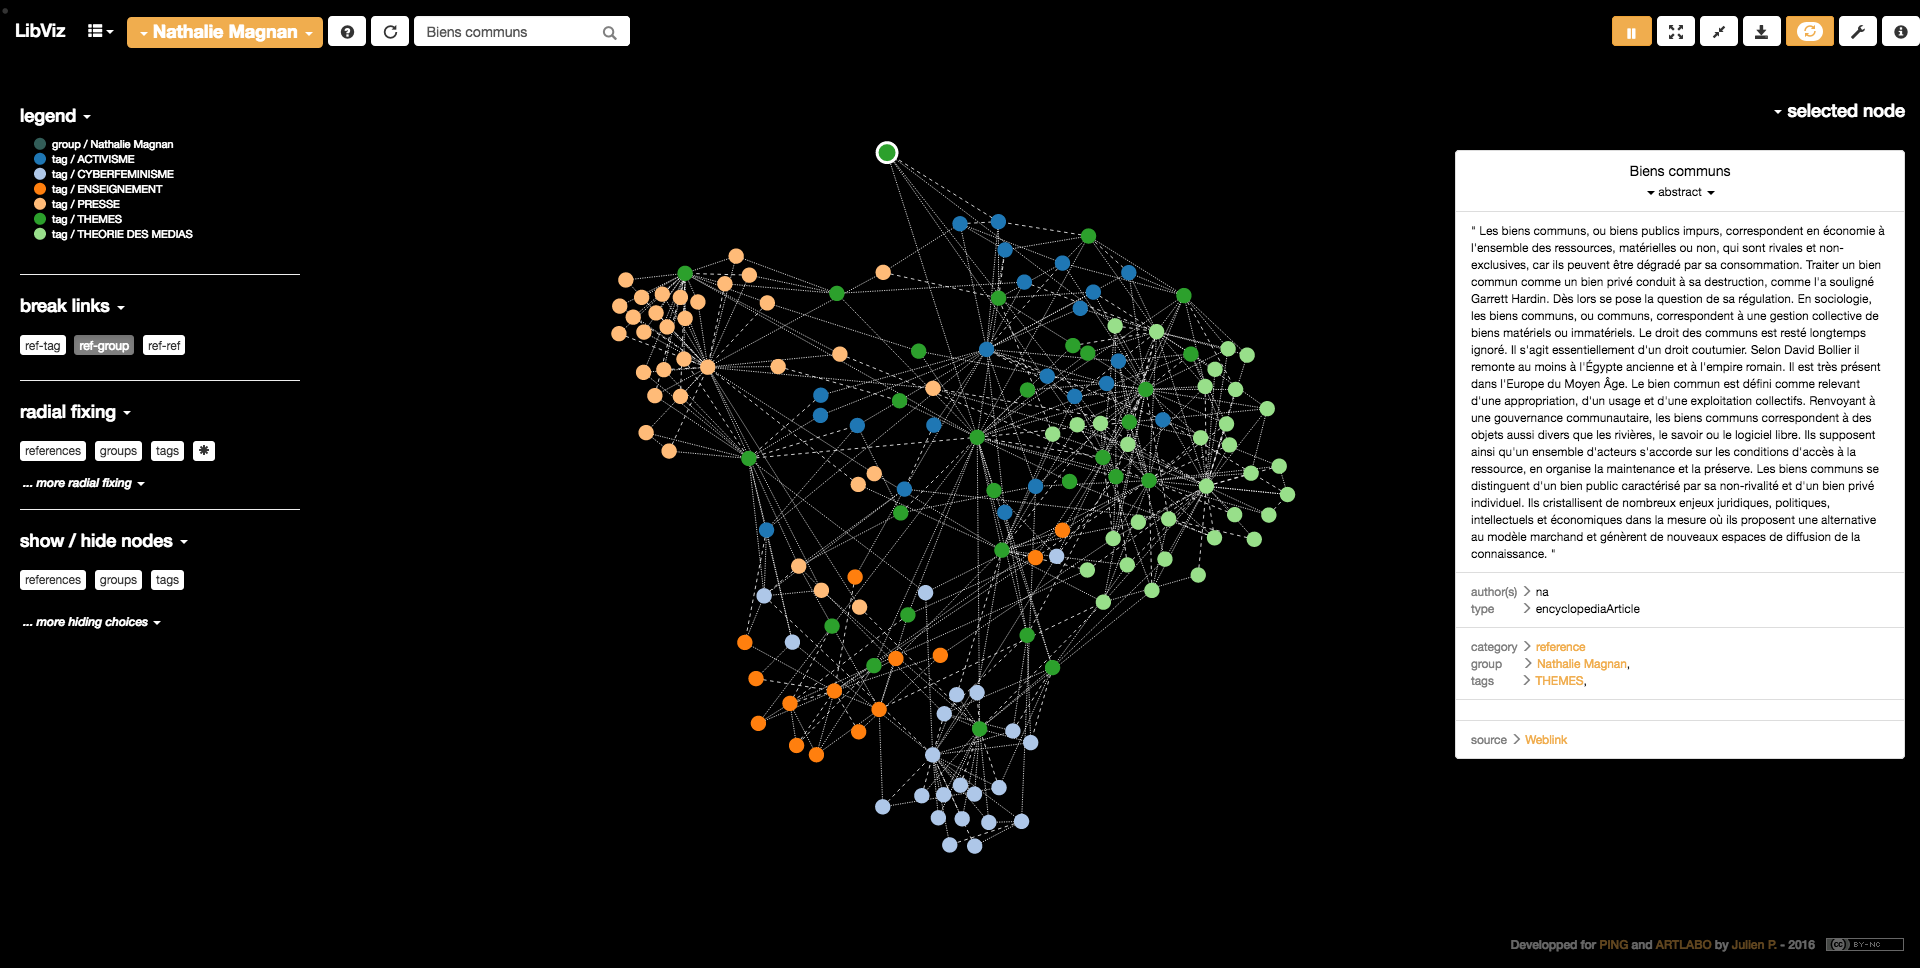
LibViz allows to generate data visualisations (graphs) from sets of Zotero references.
LibViz started as a part of 1.CAMP, which a larger project aiming to cross different topics as the anthropocene era, art, new practices, scientific research, ... Julien Bellanger from PING could tell more about this part...
Then other people join the project, wanting some visualisation for their own datasets : other bibliographical references gathered in Zotero. So the project eventually aimed to be as 'neutral' as possible to accept any kind of dataset from Zotero.
LibViz development is documented here.
LibViz is powered by :
- Python to get the references and create the JSON datasets
- Zotero to organise bibliographical references
- Flask as backbone of the website
- Bootstrap for the global aspect website
- d3.js by Mike Bostock to create the graph visualisation
Project by PING / ARTLABO and developped by Julien P with the precious help of Julien B., Benjamin C., Ewen C., Xavier from Bureau d'études
This application is inspired by a previous work called "Constellations bibliographiques" developped by Laurent Malys.
To develop & test this application, you can use a Python “virtualenv”. To proceed, just install the Debian package python-virtualenv, create a new “virtualenv”, activate it and then install the required dependencies:
$ sudo apt install python-virtualenv
$ cd LibViz
$ virtualenv venv
$ source venv/bin/activate
$ pip install -r requirements.txt
$ python run.py
To deploy this application with Apache2, you have to install mod_wsgi (available in Debian in the libapache2-mod-wsgi package). You can then add the following snippet in your VirtualHost’s configuration:
DocumentRoot "/home/artlabo/www/libviz.artlabo.org/LibViz"

WSGIDaemonProcess libviz user=artlabo group=artlabo threads=5 python-home=/home/artlabo/www/libviz.artlabo.org/LibViz/venv python-pat$
WSGIScriptAlias / /home/artlabo/www/libviz.artlabo.org/LibViz/libviz.wsgi

<Directory /home/artlabo/www/libviz.artlabo.org/LibViz/>
        WSGIProcessGroup libviz
        WSGIApplicationGroup %{GLOBAL}
        Require all granted
        AllowOverride All
        #Order deny,allow
        #Allow from all
</Directory>
This configuration requires to install a Python “virtualenv” in /home/artlabo/www/libviz.artlabo.org/LibViz/venv.
Apache server should be reloaded after each code change.
LibViz uses Flask to work. With the above configuration, restarting apache will start Flask and so the LibViz app.
LibViz is licensed under a Creative Commons Attribution 4.0 International License .

