InsideMe is a simple yet effective python module for monitoring memory consumption and duration of python codes. Work for both serial codes and parallel programming (MPI).
This code has the following dependencies (see the travis install section):
- numpy, matplotlib (required)
- mpi4py (optional - for parallel computing)
You can easily install the package using pip
pip install InsideMeOtherwise, you can clone the repo from the github repository and use the setup.py for the installation. Just run:
python setup.py installMake sure you have correct permissions (otherwise just add --user). You can also directly use the code by updating manually your PYTHONPATH. Just add in your bashrc:
InsideMePATH=/path/to/the/package
export PYTHONPATH=$PYTHONPATH:$InsideMePATH:$InsideMePATH/InsideMe
Alternatively if you do not want install the package on your computer, you can also use the dockerfile provided to create a docker image:
docker build -t InsideMe .
docker run -it InsideMe
or pull directly the docker image and launch an interactive session:
docker pull julienpeloton/insideme:latest
docker run -i -t julienpeloton/insideme:latest bashThe profiling of a code is done using decorators. Typically, if you want to monitor the time spent inside a function and its memory usage, simply add a decorator
## content of toto.py
from InsideMe import profiler

@profiler.benchmark
def myfunc(args):
    ...
The profiler will collect informations during the execution of the program, and store it on a log file. By default, the profiler will use the name of the function for future reference. It is often the case that one wants to group functions under categories. You can specify this by directly passing category (field) as parameter to the decorator:
## content of toto.py
from InsideMe import profiler

@profiler.benchmark(field='something')
def myfunc1(args):
    ...

@profiler.benchmark(field='something else')
def myfunc2(args):
    ...

@profiler.benchmark(field='something else')
def myfunc3(args):
    ...

@profiler.benchmark(field='something else else')
def myfunc4(args):
    ...
Once your run is done, analyze the logs using the analyzer:
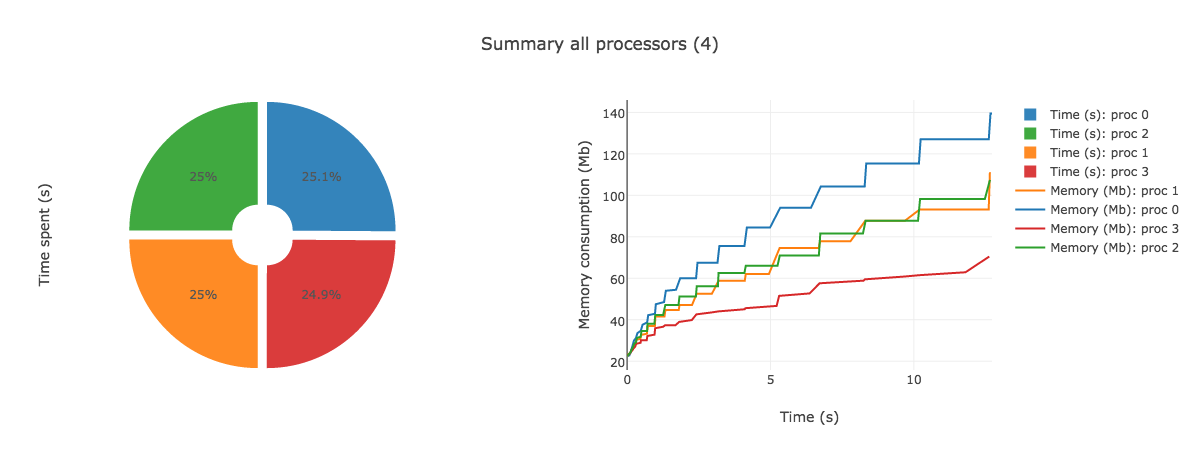
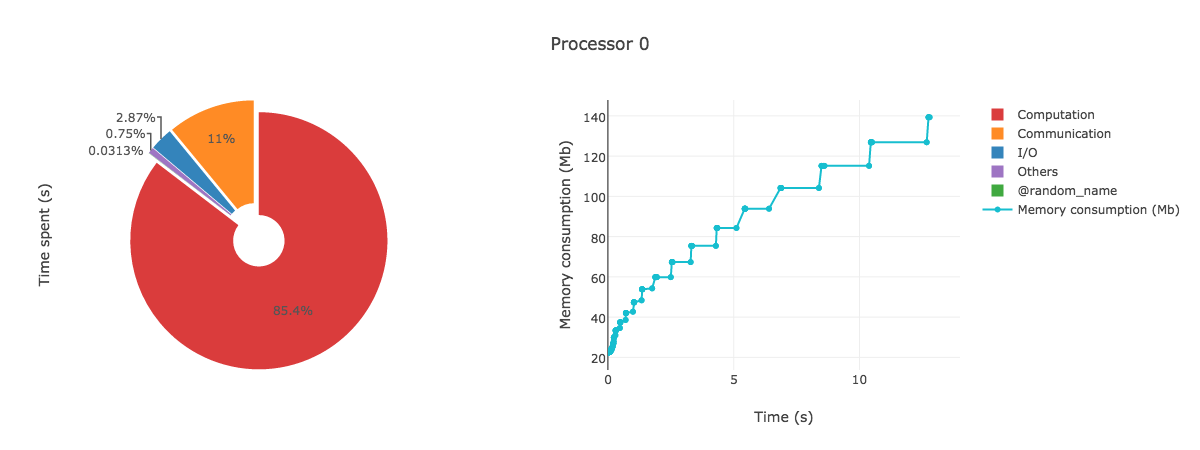
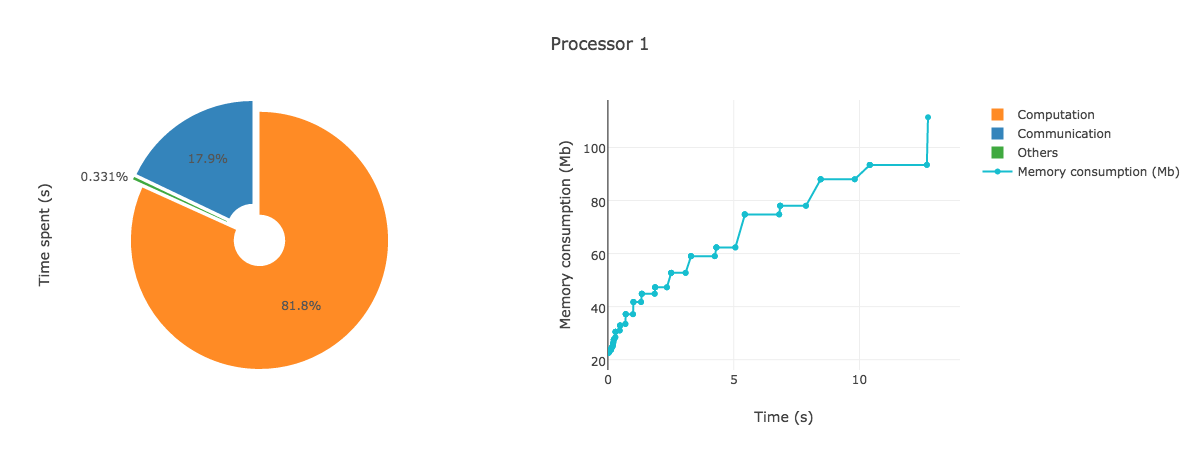
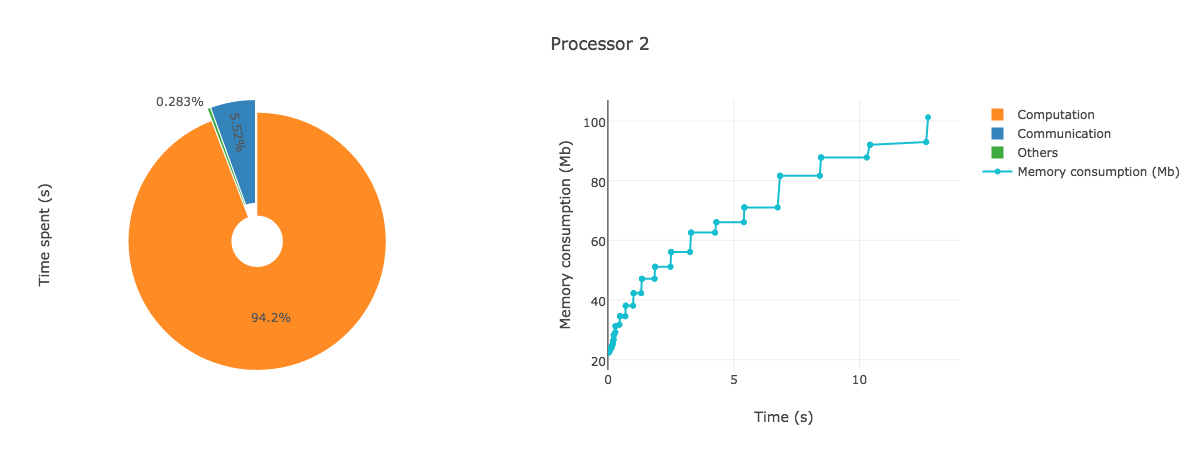
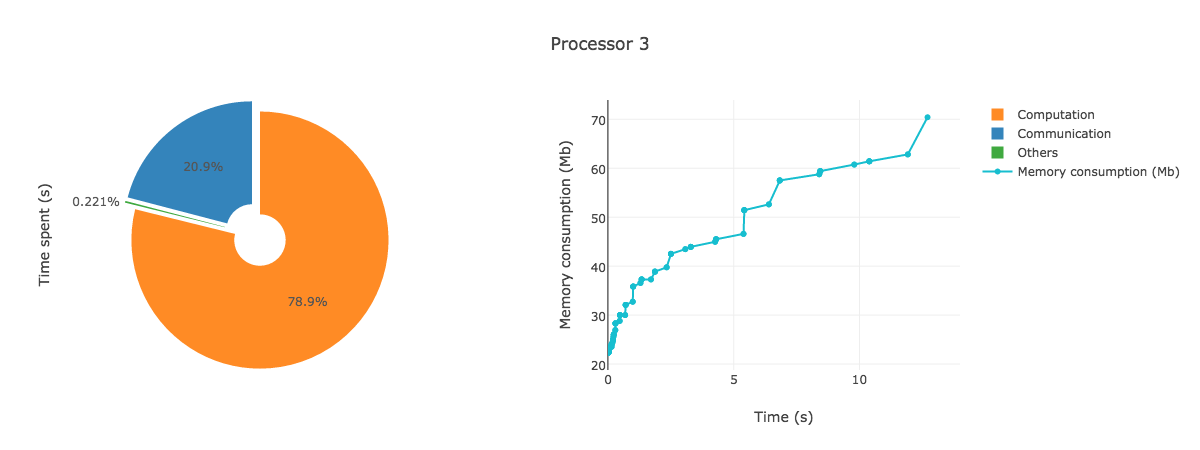
AnalyzeMe --output <folder>The analyzer will create a folder given by the output argument, store the logs in it and produce a html file with plots showing the duration and memory consumption per processors.
Try to run the test script provided on say 4 processors:
mpirun -n 4 python tests/test.pyIf necessary, change mpirun with your favourite shell script for running MPI applications.
You should see 4 log files created in your root folder of the form logproc_proc#_total.log
Analyze those outputs using the analyzer:
AnalyzeMe --output prof/Open the html file produced in your browser, you should see something like (interactive plots)
- TBD
- New logs with same output are not analyzed
- Fix max time for the summary of processors (always truncated too early)
GNU License (see the LICENSE file for details) covers all files in AnalyzeMe repository unless stated otherwise.
