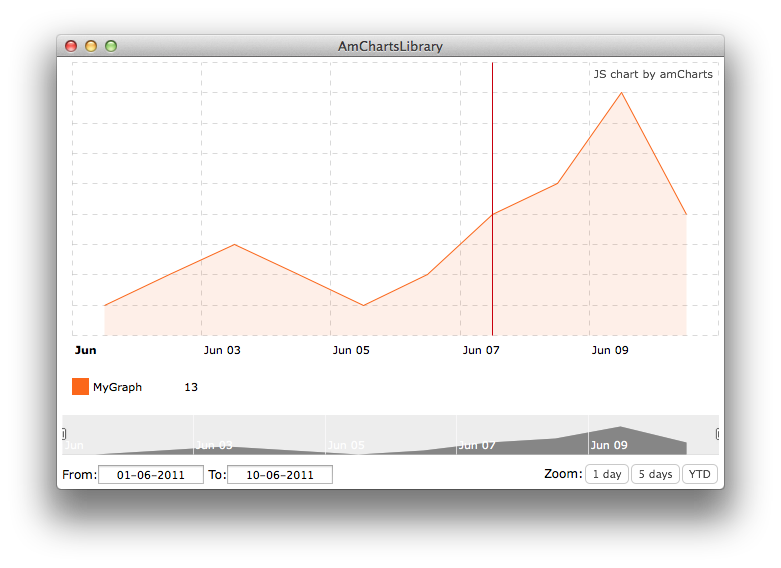
This is a Native Objective C wrapper for the AmCharts javascript charting library. Both OS X (10.7+) and iOS (7.1+) are supported.
- Clone this repo
- In your project Add the freshly cloned 'AmChartsLibrary.xcodeproj' to your workspace. Adding an Existing Project to a Workspace
- Add a link to the AmCharts.framework by selecting your target > General Pane > Linked Frameworks and Libraries
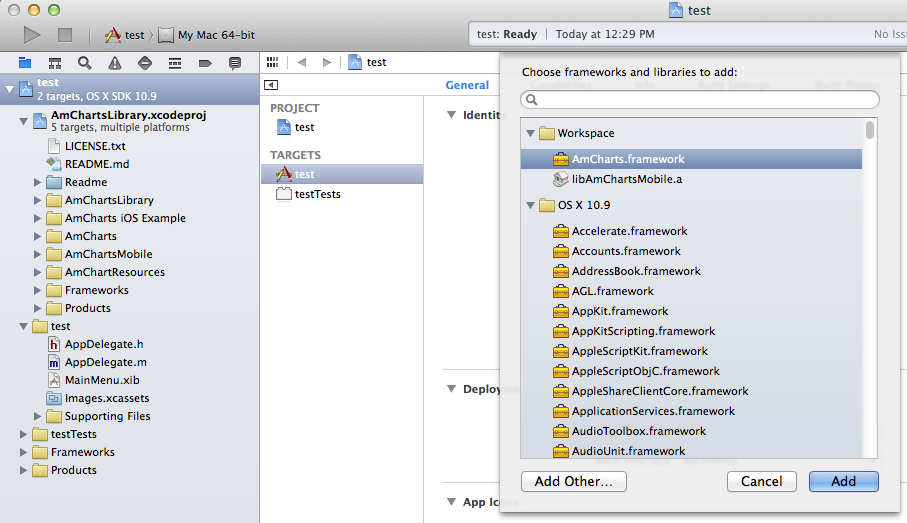
- In "Build Phases" add the AmCharts.framework as a target dependency
- Add a new "Copy Files Build Phase"
- Set the destination to "Frameworks"
- Add the AmCharts.framework
You can now start generating charts in your app!
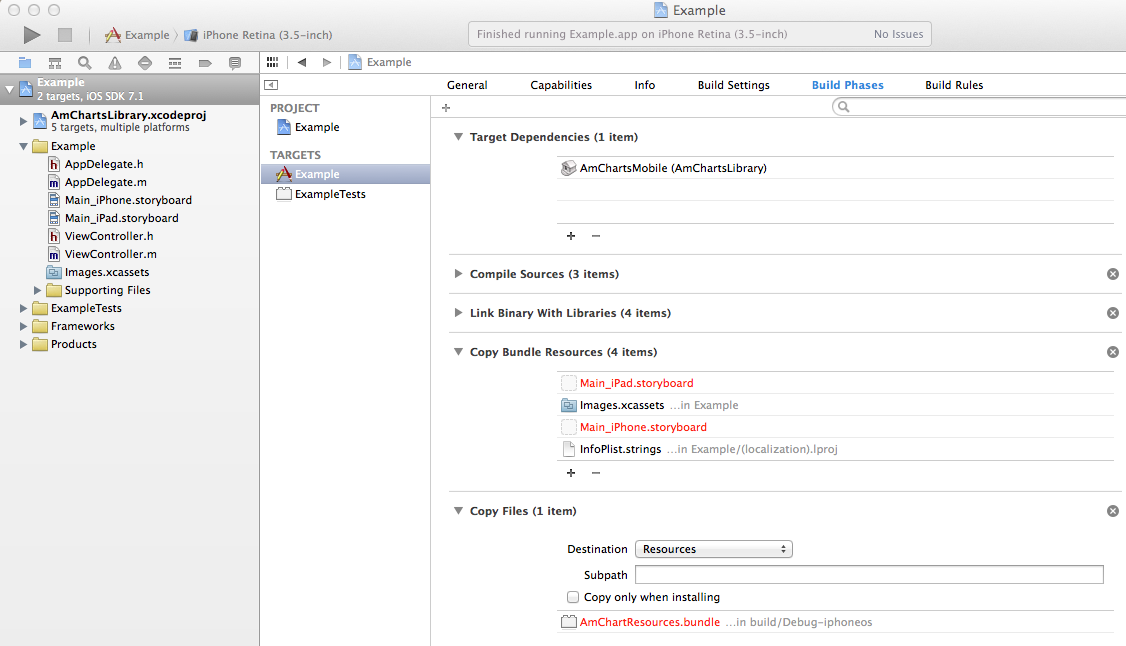
- Add a link to the libAmChartsMobile.a by selecting your target > General Pane > Linked Frameworks and Libraries
- Under "Build Settings" add -ObjC to "other linker flags"
- Under "Build Phases" add AmChartsMobile to the target dependencies
- Add a new "Copy Files Build Phase"
- Set Destination to "Resources" and add the "AmChartResources.bundle"
Once the AmChart framework or library is included in your project. Generating a chart is very simple. Import the framework
#import <AmCharts/AmCharts.h>
if you are building an iOS app use this instead:
#import <AmChartsMobile/AmCharts.h>
Add an AmChartView (inherits from Webview) or AmMobileChartView (inherits from UIView) to your window.
Here are some examples of common charts.
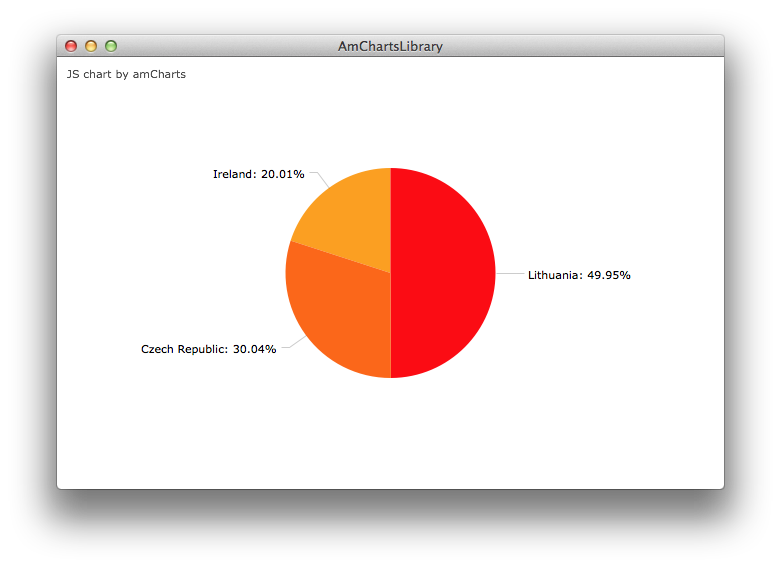
AmPieChart *pieChart = [[AmPieChart alloc] init];
pieChart.type = @"pie";
pieChart.theme = @"none";
NSMutableArray *dataProvider = [[NSMutableArray alloc] init];
[dataProvider addObject:@{@"country" : @"Lithuania", @"litres" : @(501.9)}];
[dataProvider addObject:@{@"country" : @"Czech Republic", @"litres" : @(301.9)}];
[dataProvider addObject:@{@"country" : @"Ireland", @"litres" : @(201.1)}];
pieChart.dataProvider = dataProvider;

pieChart.valueField = @"litres";
pieChart.titleField = @"country";

// where self.chartView references an AmChartView *
[self.chartView setChart:pieChart];
[self.chartView drawChart];This code:
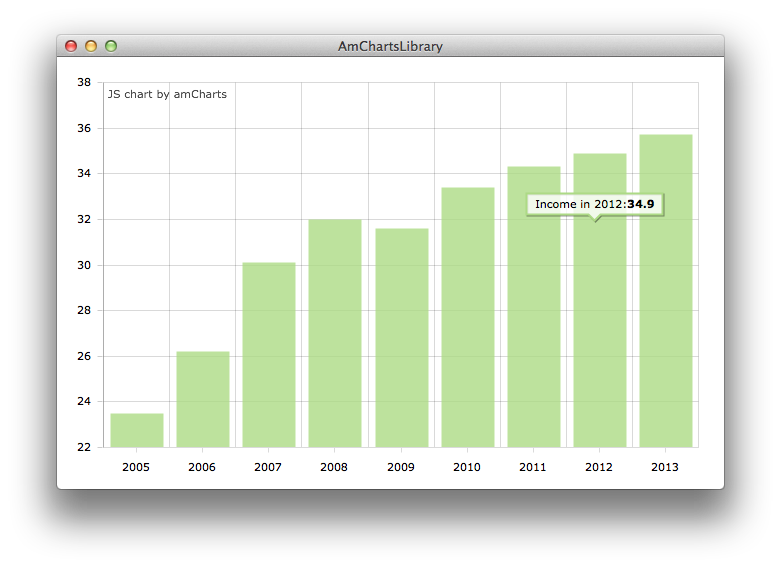
AmSerialChart *chart = [[AmSerialChart alloc] init];
chart.type = @"serial";
chart.dataProvider = [@[@{@"year" : @"2005", @"income" : @"23.5"},
                       @{@"year" : @"2006", @"income" : @"26.2"},
                        @{@"year" : @"2007", @"income" : @"30.1"},
                        @{@"year" : @"2008", @"income" : @"32.0"},
                        @{@"year" : @"2009", @"income" : @"31.6"},
                        @{@"year" : @"2010", @"income" : @"33.4"},
                        @{@"year" : @"2011", @"income" : @"34.3"},
                        @{@"year" : @"2012", @"income" : @"34.9"},
                        @{@"year" : @"2013", @"income" : @"35.7"}] mutableCopy];
chart.categoryField = @"year";
//chart.rotate = YES;
chart.categoryAxis.gridPosition = @"start";
chart.categoryAxis.axisColor = @"#DADADA";
AmValueAxis *valAxis = [[AmValueAxis alloc] init];
valAxis.axisAlpha = @(0.2);
chart.valueAxes = [@[valAxis] mutableCopy];
chart.balloon = nil;
AmGraph *graph = [[AmGraph alloc] init];
graph.type = @"column";
graph.title = @"Income";
graph.valueField = @"income";
graph.lineAlpha = @(0);
graph.fillColors = @"#ADD981";
graph.fillAlphas = @(0.8);
graph.balloonText = @"[[title]] in [[category]]:<b>[[value]]</b>";
chart.graphs = [@[graph] mutableCopy];

[self.chartView setChart:chart];
[self.chartView drawChart];This repo contains both a Mac and iOS example app. You can check how they are set up to make sure that your own project is configured properly. The AmChart website has extensive documentation as well as numerous tutorials. If you find a bug in this wrapper library, send me a pull request with a fix, or at the very least do some detective work first before opening up an issue.
The source for AmChartsLibrary (the objective-c wrapper) is released under the MIT license. The original AmCharts javascript core is maintained under a separate license. Check http://www.amcharts.com/online-store/ for further information.
