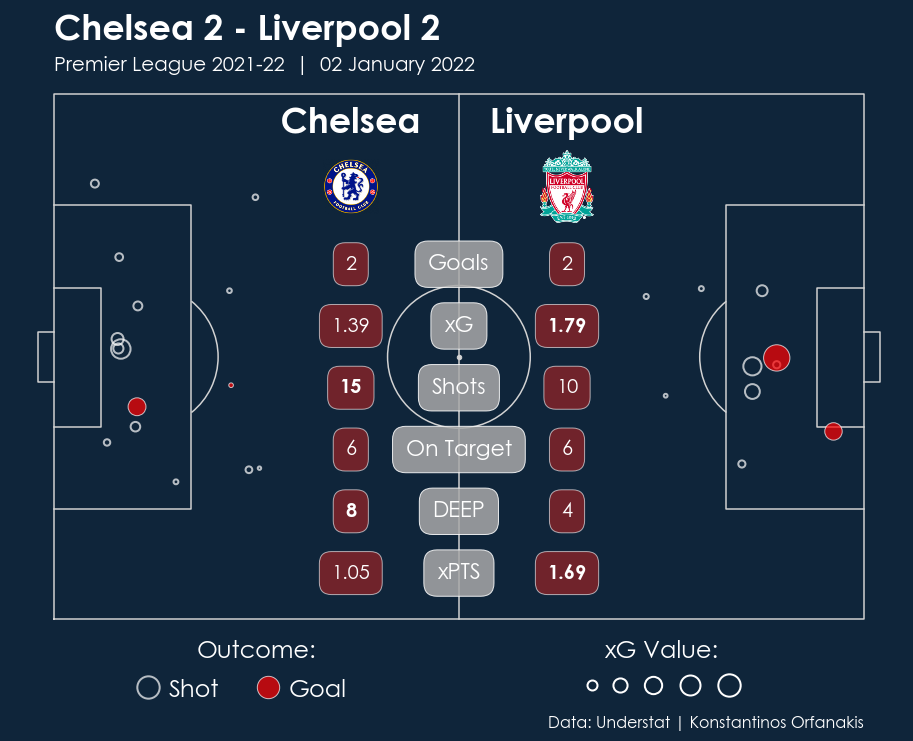
Match report for the game between Chelsea and Liverpool that took place on the 2nd of January, 2022.
Table of Contents:
This repository contains Python code for:
- Web scraping a football match from Understat, and
- Creating a figure that summarises that particular match. Specifically, the final figure displays various stats (e.g. goals, shots, shots on target, xG, etc.) on top of a shot map for both the home and away teams.
For now, we are limited to matches from the English Premier League. However, we can easily expand to other leagues by adding a few lines of code and including the crests for the additional teams in the designated folder.
The code is organised into three different Python scripts:
-
draw_football_pitch.py: As the name suggests, this file contains a function for visualising a football pitch. It is extracted from the article ‘How to Draw a Football Pitch’ by McKeever (accessed 17-01-2022). The only modification is not showing the two penalty spots as they can easily get confused with missed shots in the final figure. -
match_scraper.py: The second file contains a collection of functions for extracting the data (shots and goals) and various information used for the final figure (e.g. stat summary, headline, date, etc.). -
match_visualisation.py: The final Python file contains the function (create_figure()) for creating the figure. Notice that the function requires three arguments: the ID of the game we want to visualise and the figure and axes objects of the plot.
The repository also contains a Jupyter notebook that demonstrates how to run the code and create the figure. Also, please refer to my Kaggle notebook for a better walkthrough of the code.
Python Version: 3.6.8
Packages: numpy (1.19.5), pandas (1.1.5), matplotlib (3.3.4), json (2.0.9), requests (2.25.1), bs4 (4.9.3).
All data used in this tutorial are extracted from Understat's website. The final design of our figure has been influenced by various sources such as The Analyst (for example, see this tweet), Stats Perform, and Sport24.gr
[1] How to Draw a Football Pitch by Peter McKeever (Accessed: 17/01/2022)
[2] Shot Maps by McKay Johns (Accessed: 18/01/2022)
[3] Understat Series : Shotmaps by José González (Accessed: 10/01/2022)


