A series of functions for collecting hydrological and weather data from different sources in the context of stormwater management.
The functions can be loaded with source():
source('.../stormRunoff.R')
source('.../weather.R')Data from tipping bucket runoff loggers can be read using function readTipbucket:
# read data from runoff logger
runoff <- readTipbucket(rawdir='..../runoff_logger_data/', dateFormat='%Y-%m-%d %H:%M:%S', timeZone='Etc/GMT-1')
Parameters:
rawdir: Directory containing raw data filesdateFormat: Date and time format in the raw datatimeZone: Time zone of time stamps in the raw data
If there are different data files covering different overlapping or non-overlapping time periods (e.g., file 1: 1-Jan-2020 to 15-Jun-2020, file 2: 1-Jun-2020 to 10-Oct-2020, file 3: 15-Nov-2020 to 31-Dec-2020, etc.), the function automatically generates a single time series, filling gaps with NA
Function updateRainDB fetches rainfall data for a selected time period from an in-house and an external server and adds it to a local data base (plain text file). As a first step, the user must manually create an NA-filled data base covering the project's time period as template. Format:
| dateTime | gauge1 | gauge2 | gauge3 | ... |
|---|---|---|---|---|
| 2019-10-15-19:00 | NA | NA | NA | NA |
| 2019-10-15-19:05 | NA | NA | NA | NA |
| 2019-10-15-19:10 | NA | NA | NA | NA |
| 2019-10-15-19:15 | NA | NA | NA | NA |
| 2019-10-15-19:20 | NA | NA | NA | NA |
| ... | ... | ... | ... | ... |
Time stamps must be in the first column, with column name dateTime.Date and time format must be as shwon here. gaugeX stands for the names of the gauges as they are in the respective servers. The function will read this template and determine from it the names of the gauges and the time period of the project.
updateRainDB fetches the new data and overwrites the rows corresponding to the time period between tBeg and tEnd (inclusive). Function usage:
updateRainDB(rawdir='.../rainfall_db/',
             rainDBname='rainDB.txt',
             tBeg='20200623',
             tEnd='20200623',
             tFalseRainName='tFalseRain.txt',
             login='xxxxx:xxxx',
             D2Wsid='xxxxxxx',
             skip="",
             overwriteOldDB=TRUE,
             summerTime=data.frame(year=c(2020, 2021),
                                   start=c("29-Mrz-20 03:00:00 +0200",
                                           "25-Okt-20 02:55:00 +0200"),
                                   end=c("28-Mrz-21 03:00:00 +0200",
                                         "31-Okt-21 02:55:00 +0200")))
Parameters:
rawdir: Directory containing the rainfall databaserainDBname: Name of rainfall databasetBegandtEnd: Start and end dates of data to be fetchedtFalseRainName: Name of file containing time stamps of manually adjusted data points. In this use case, the raw data may contain data points with false rain resulting from gauge maintenance. These data points are adjusted manually in the data base and their time stamps are registered in this file so that the function skips over them the next time a download occurrs. This avoids overwritting the corrected data.login: User name and password for the in-house serverD2Wsid: Session ID for the external serverskip: This parameter offers the possibility of skipping either server.skip=BWBskips external server,skip=BWBskips in-house serveroverwriteOldDB: IfTRUE, overwrites the rows with the new data directly in the existing data base. IfFALSE, generates a copy of the existing data base and overwrites the raws there. The copy will have the same name as the original data base with_newappended to it.summerTime:data.frameindicating the start and end (first and last time stamps) of the summer daylight saving time in the current use case. Important: the current version of the function was written for use in time zoneEtc/GMT-1(Germany, no daylight saving time). Time zone will be added as a user-given parameter in future versions.
https://opendata.dwd.de/climate_environment/CDC/
updateWeatherDB uses download.file to access the German Weather Service's Climate Data Centre and download the current contents (last 500 days) of recent/10minutenwerte_XXXX_00, where XXXX stands for the desired weather variable (see below). Downloaded data are added to a user-created plain text file, as done for updateRainDB.
Function usage for temperature data:
updateWeatherDB(rawdir='.../weather_data/',
                dbName='tempDB.txt',
                dwdCols=c('MESS_DATUM', 'TT_10', 'RF_10', 'QN'),
                dwdStationID=430,
                overwriteOldDB=TRUE)
Parameters:
rawdir: Directory containing the weather data basesdbName: Name of data base plain text file. In the example above the function will work on the temperature data basetempDB.txt.dwdCols: Names of the desired columns in the original DWD data. See DWD data set documentation.dwdStationID: DWD station numberoverwriteOldDB: IfFALSE, creates a copy of the original data base and adds the downloaded data there, appending_newto the name. IfFALSE, adds the downloaded data to the original data base.
readWeatherDB is a simple wrapper around read.table for reading the above weather data bases.
rainData <- readWeatherDB(rawdir='.../weather_data/',
                          dbName='rainDB.txt',
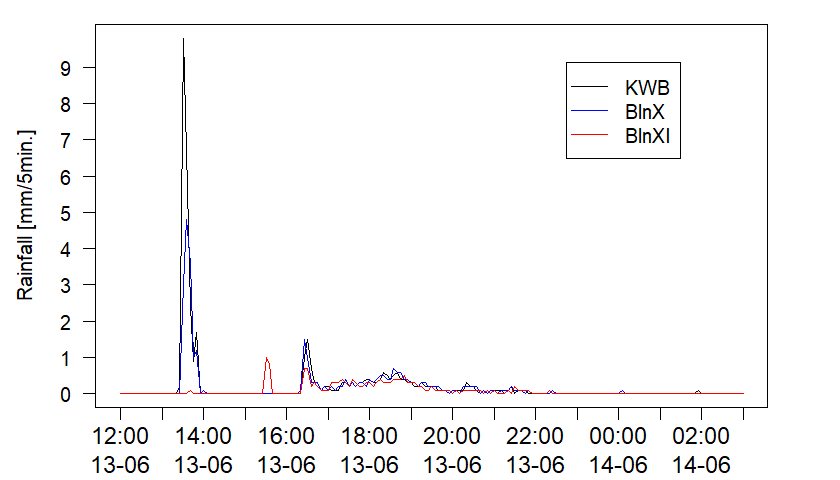
naStrings=c('NA', '[-11059] No Good Data For Calculation'))checkRain allows plotting rainfall at multiple rain gauges for a selected time window:
checkRain(rainData=rainData,
          gauges=c('KWB', 'BlnX', 'BlnXI'),
          col=c('black', 'blue', 'red'),
          lty=c(1, 1, 1),
          pch=c(NA, NA, NA),
          tBeg='2020-06-13 12:00',
          tEnd='2020-06-14 03:00',
          dt=1*3600,
          dy=1)
checkWeather creates a plot for visualizing rainfall, wind and temperature simultaneously.
checkWeather(tBeg='2020-06-13 12:00',
             tEnd='2020-06-14 03:00',
             dt=3600*1,
             rainData=rainData,
             windData=windData,
             tempData=tempData,
             rainScale=20,
             rainGauge='KWB')
Parameter rainScale controls the scaling of the rainfall data on the inverted axis at the top of the plot. Axis and data point colors indicate the variables. A statistical summary is presented at the top, including total rainfall depth (hN, units = milimeters), mean(standard deviation) for wind direction (wDir, units = counter-clockwise degrees from North), and mean(standard deviation) for wind speed (wSpeed, units = meter/second).

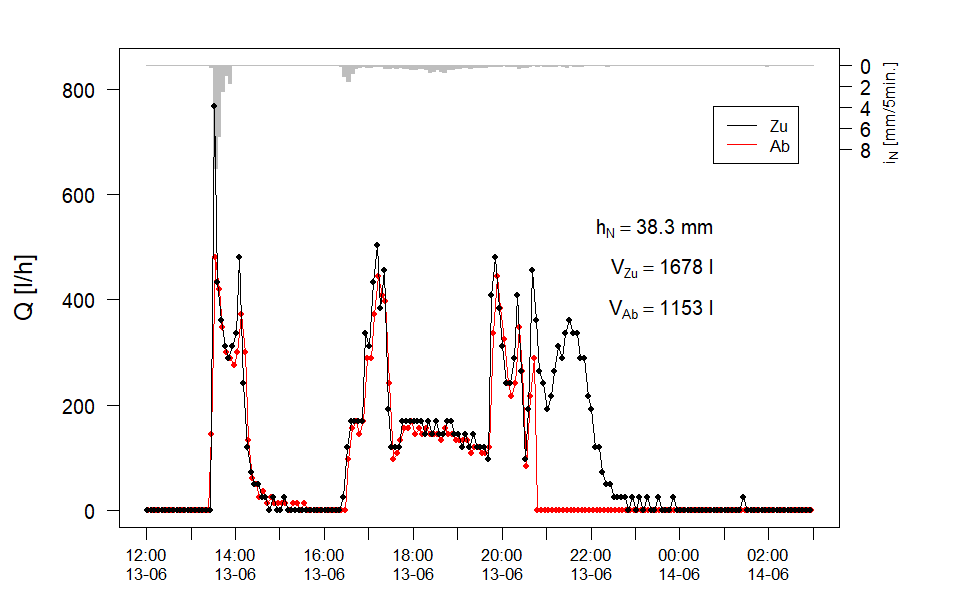
plotEvent graphs runoff and rainfall simultaneously for a user-defined time period. In this example there are two runoff loggers (Qzu, Qab) and one rain gauge (KWB). The function also performs a numerical integration of the discharge curves (using function computeVol, see script stormRunoff.R) and writes the total volume for each logger on the plot (labeled here as Vzu and Vab, units = liter), together with the rainfall depth (hN) in milimeters.
plotEvent(tBeg='2020-06-13 12:00',
          tEnd='2020-06-14 03:00',
          dt=3600*1,
          inflowQ=Qzu, outflowQ=Qab, rainData=rainData,
          rainGauge='KWB',
          rainScale=20)
