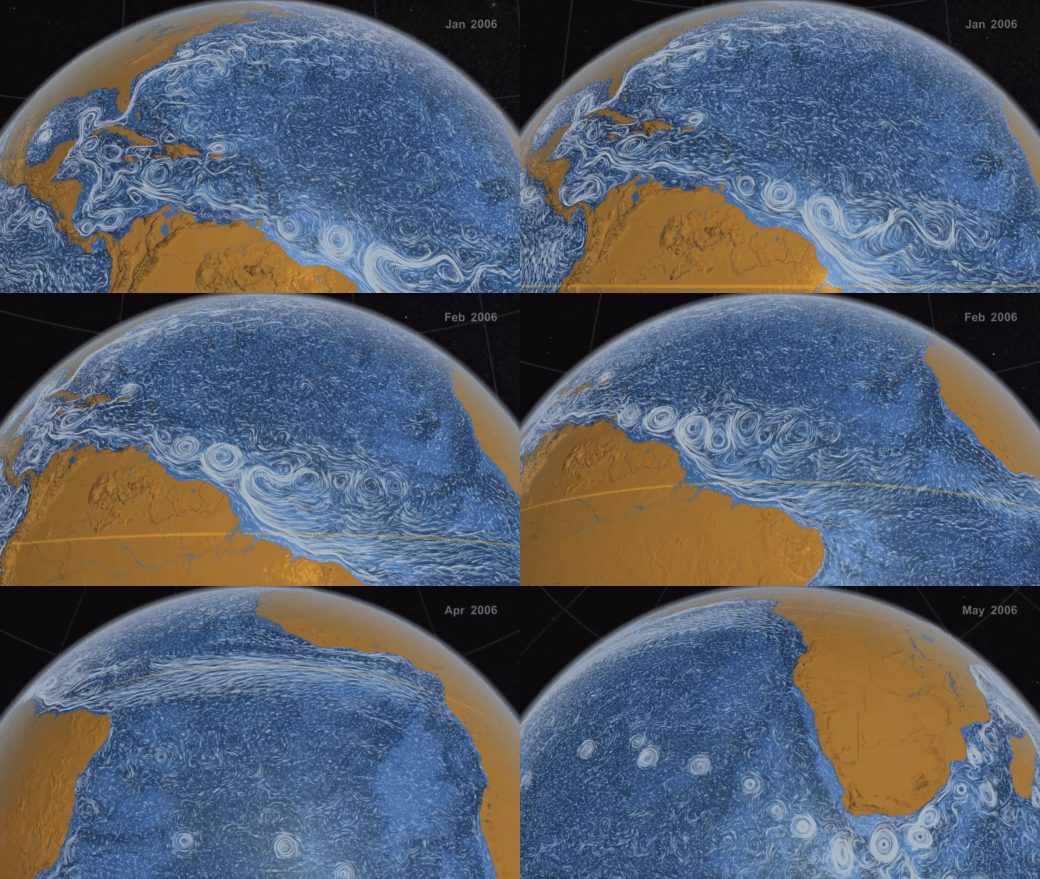
- Eddies are clockwise or counter-clockwise circular movements of water that play a major role in transporting energy and biogeochemical particles in the ocean.
NASA Visualisation Studio
This project does visualization of eddies present in red sea and finds interesting statistics to study behavior of eddies.
- Given the narrow nature of the basin, many eddies can occupy more than half of the Red Sea width, providing rapid transport of organisms and nutrients along the coastline and between the african and Arabian Peninsula coasts.
- These marine
whirlpoolsare much more frequent than what had been previously thought, profoundly affecting the social and economic lives of people living in the surrounding countries.
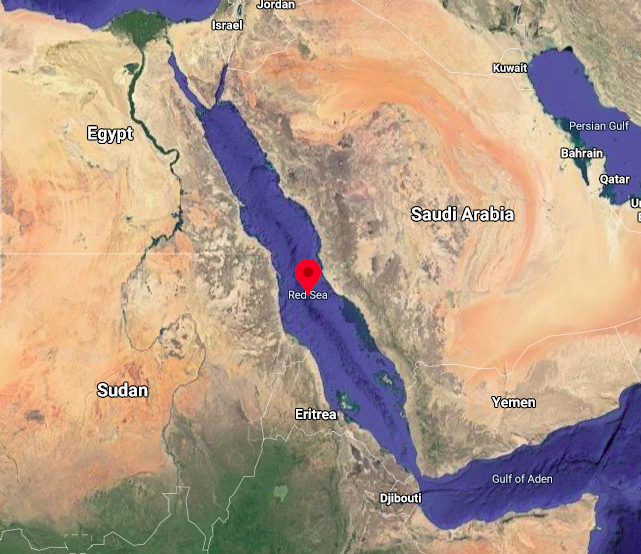
Red Sea - Google Maps
- This is a course project of Graphics and Visualization course.
- Problem statement for this project is taken from IEEE SciVis Contest 2020
- This project solves
Eddy Visualization in 3DandInteresting Eddy statisticstasks of contest. It tracks eddies over multiple time intervals and derive important statistics like births/deaths or path of eddies.
Ensembled data of red sea is provided on contest webpage.
- Inviwo - Open Source Scientific Visualization tool.
Matlabfor fast Data processing.- Visualization libraries like
py-plot,networkx. - Data processing libraries in matlab/python like pandas.
OpenCVfor Image Processing.
Note : To view images in high resolutionn goto img/Outputs
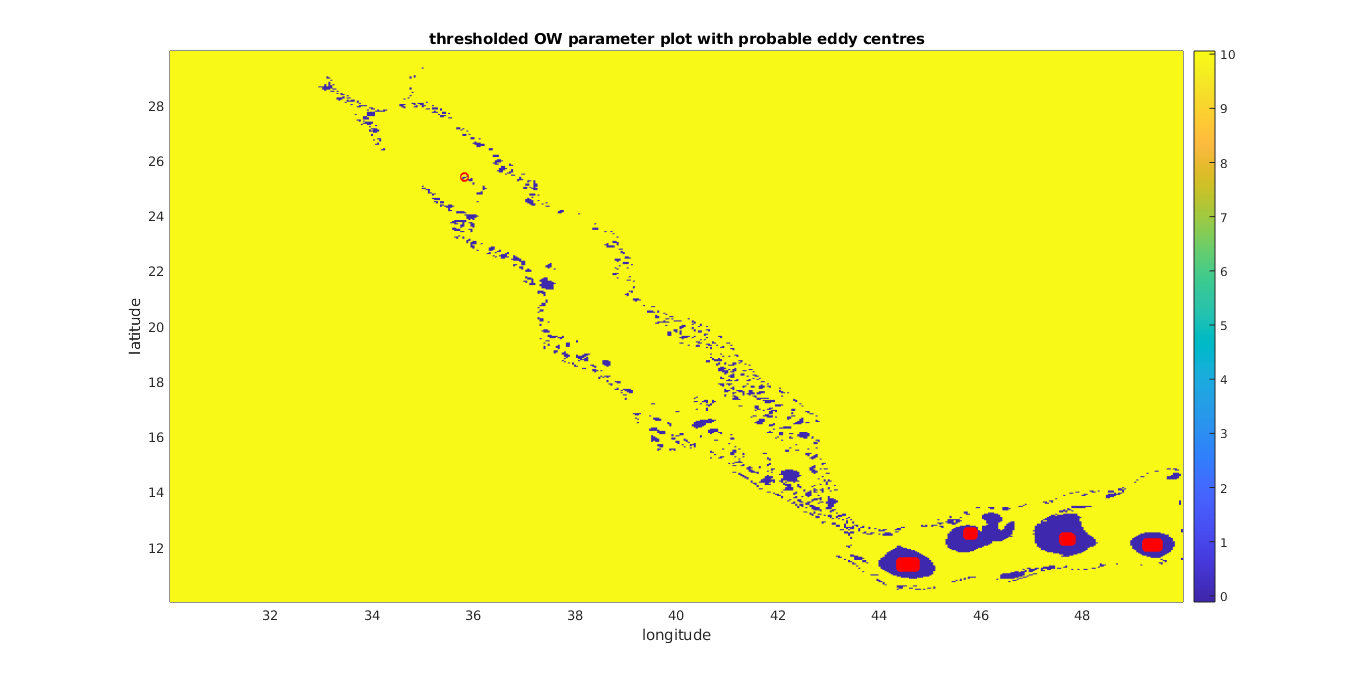
- Detected meso-scale eddies using Okuba-weiss parameter from
velocity fieldin dataset.
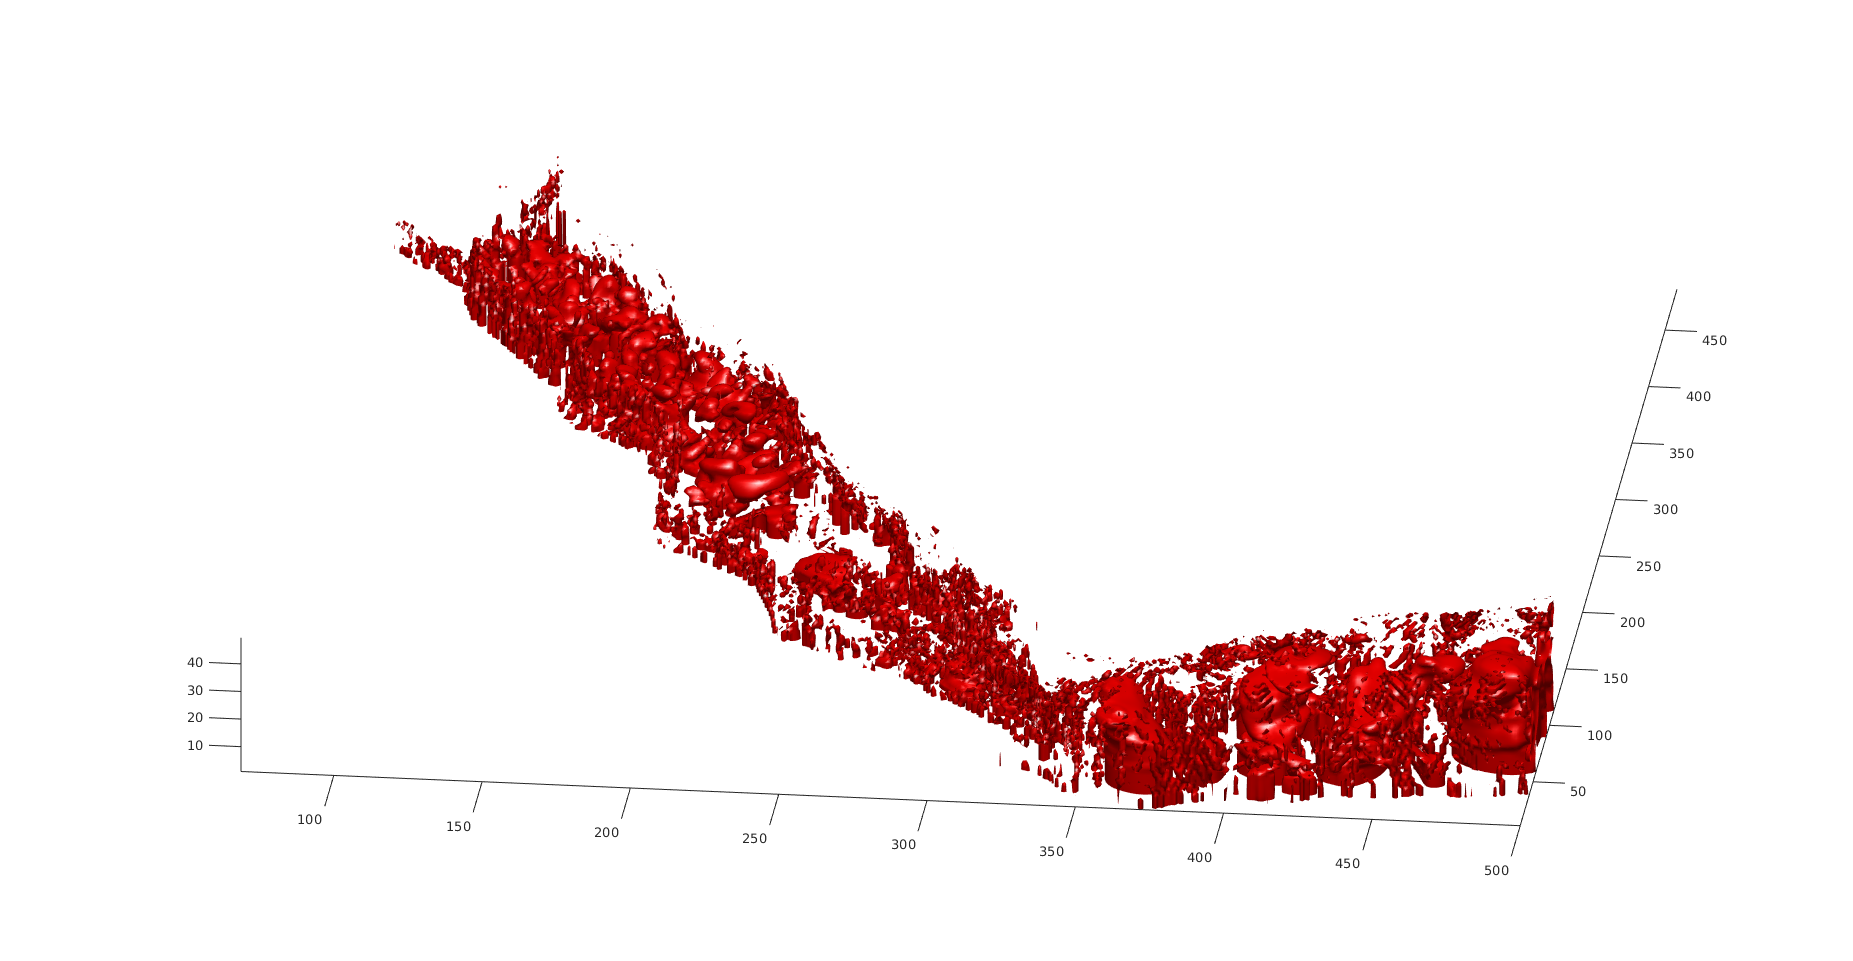
3D Eddy Visualisations
- Filtered out
false postitiveeddies using Gemotrical constraints mentioned in this paper.
Surface Level Meso-scale Eddies
- Applied
Bredth First Searchalgorithm on detected eddy centers from above step over 3D region till threshhold value of Okuba-weiss parameter is reached. - Generated possible regions of Eddies in 3D space and then this new data is visualized using
Inviwotool.
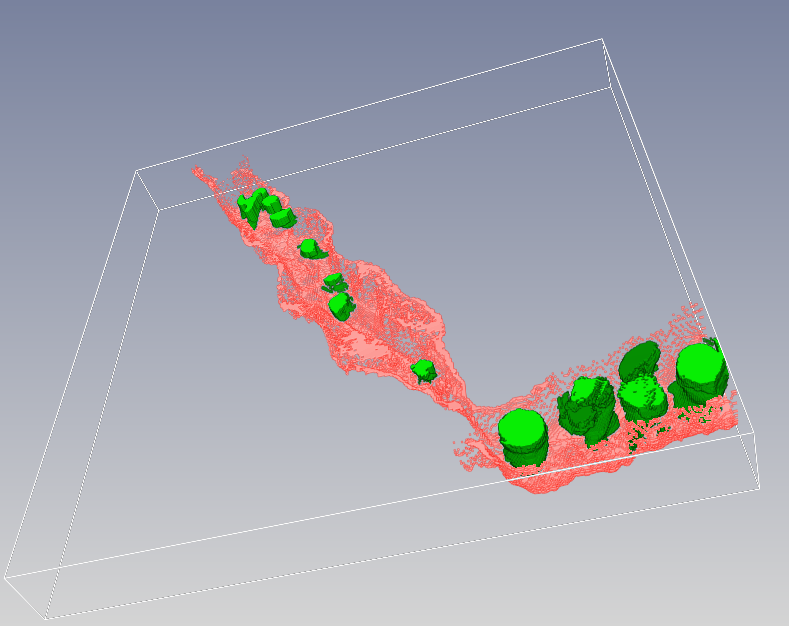
Here in Inviwo we can interactivly study shapes of these eddies in 3D.
Green : Eddies.
Pink : Sea Bed from Bathy metry data.
3D Eddy Visualisations with Bathymetry Data at Timestep 15
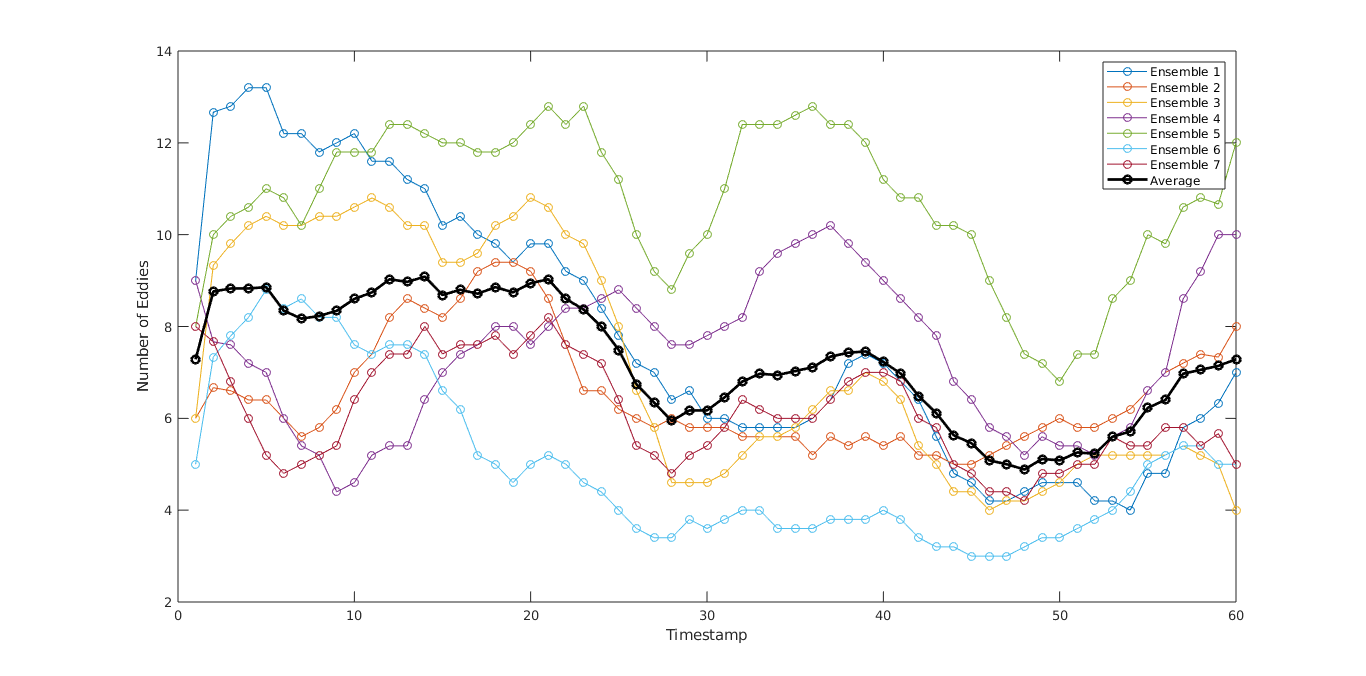
- Calculating this eddy information over all ensembles we plotted count of eddies graph.
Eddy Count over 7 ensembles
- To validate our detected eddies we tried
stream-line-plotsover same regions:
Streamlines and eddy detection on same graph
- To establish relationship between eddies i.e identify particular eddy is same in timestep X and X+1 we developed algorithm (see report for details) for eddy-tracking using area - overlap method.
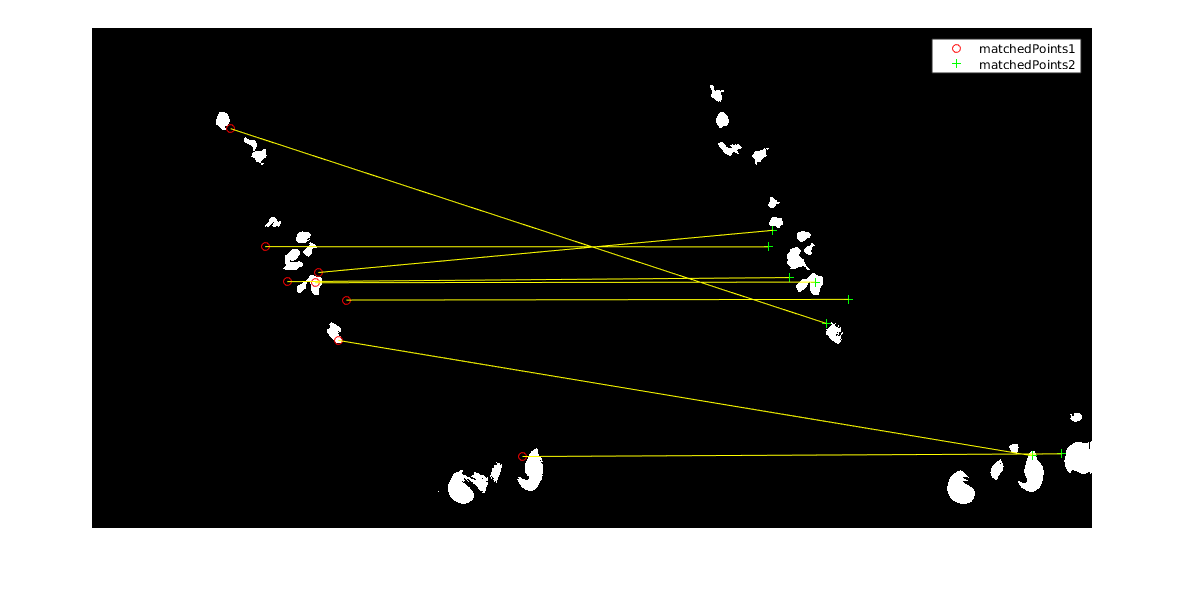
Also tried matlab's
SURFfeature to identify same eddies over different time interval:
SURF from matlab
- To make this anaylysis as real time as posible we used
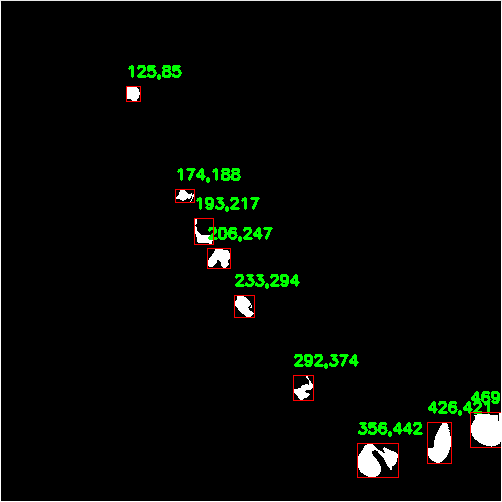
Image Processingto track eddies between images of surface eddies.
Eddy Detection from images and their centroids
- Applied object detection algorithms on images of eddies using
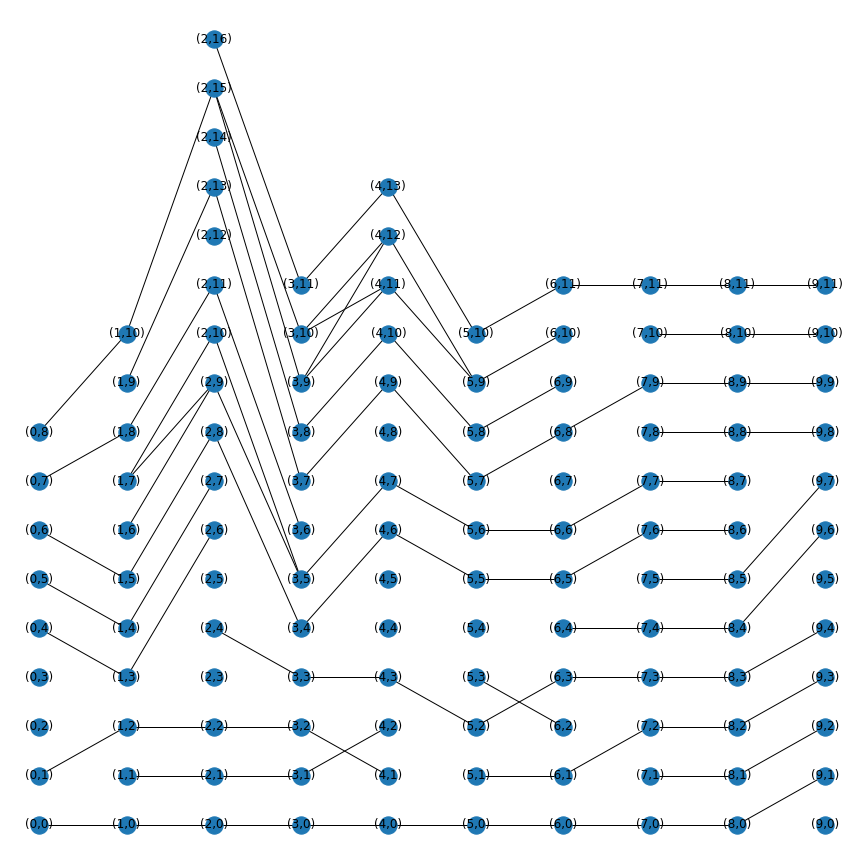
Contour Detection.For each detected objects we can assign features like centroid of eddy, shape of contours, area of contours, After that we can search for eddies with same features in next few timesteps. - Once tracking is done from previous step now to Visualise eddy-relationships we tried to show it graph format as below.
Eddy Life Graph
Each Column of nodes represents eddies from that timestep and edge between node represents these two eddies are same,just images at different timestep.- From this network we visualised Deaths/Births graph and splits/merges of eddies.
Eddy Births

.png)
