
Data visualization provides an accessible way to see and understand trends, patterns in data, and outliers. Data visualization tools and technologies are essential to analyzing massive amounts of information and making data-driven decisions. Here we present the t-SNE algorithm for reducing the dimensions of the point and thus analysing the data.
Our implemented tSNE algorithm could be split into multiple modules, which are as follows :
- Reading and parsing the dataset, and separating the data into the features, and labels, and returning the feature vector
Xand the label vectory - This could be found in the
parserfolder, which returns the desired dataset feature vectors and their corresponding labels.
-
Principal component analysis (PCA)'s main goal is to minimize the number of connected variables in a data set while preserving as much of the data set's inherent variance as possible. A new set of variables called principal components (PCs), which are uncorrelated and are sorted so that the first few keep the majority of the variance included in all of the original variables, is used to achieve this.
-
The reference paper tsne suggests reducing the dimensions of the data to 30 or so components, using the standard linear dimensionality reduction method PCA.
-
This module takes input as the feature vector X ( with features > 30 ) and returns the feature vector X, with reduced features ( = 30 )
-
We apply the main
t-snealgorithm on this vector with the reduced dimensions.

- This module implemented the main t-SNE algorithm, that includes the calculation of the probability matrixes, finding the suitable sigmas for the optimal normal distribution, finding the probability matrix for points in the lower dimensional space, and finnalyy using gradient descent algorithm for minimising the cost function and reach a global optimum.
- This module takes in the reduced dimension points
Yand generates figures and plots for the same in the lower dimensional space, providing useful insights and visualizations of the data set points, with similar or related points clustered together and placed nearby in the low dimensional feature space. - We implemented the animation of the
tsnealgorithm, wherein we present the variations the points undergo as they projected in the lower dimensional space as the gradient descent step is followed. - This shows the step by step change in the projections, and clustering of similar points in the lower dimensional space.
- We attach the link for the video animations for the three data sets in the following drive link : https://drive.google.com/drive/folders/1GvQ83nCLwFHNSRVotEXsDc6SastkVC8f?usp=sharing
- The code for this could be found in the
[makeAnimation.py](http://makeAnimation.py)module. , which employs matplotlib functions to animate and create the simulation.

We used the following datasets for running and analysing our t-SNE algorithm.
-
MNIST:- The MNIST data set6 contains 60,000 grayscale images of handwritten digits. For our experiments, we randomly selected 6,000 of the images for computational reasons. The digit images have 28 × 28 = 784 pixels (i.e., dimensions).
- The data set used has 60k handwritten images of digits 0-9 ( black and white) which could be found at https://www.kaggle.com/competitions/digit-recognizer/data?select=train.csv
-
Coil-20:- The processed dataset, contains images for all of the objects in which the background has been discarded (and the images consist of the smallest square that contains the object)
- The data set could be found at https://www.kaggle.com/datasets/3defe8fe86a5eedce3906f162cc11b20dad9a7591fe713fd14308575cae47cdd
-
Netflix:- This tabular dataset consists of listings of all the movies and tv shows available on Netflix, along with details such as - cast, directors, ratings, release year, duration, etc.
- The dataset could be found at https://www.kaggle.com/datasets/shivamb/netflix-shows
-
Olivetti:- The Olivetti faces data set 7 consists of images of 40 individuals with small variations in viewpoint, large variations in expression, and occasional addition of glasses. The data set consists of 400 images (10 per individual) of size 92 × 112 = 10, 304 pixels, and is labeled according to identity. We used
sklearndatasets for the Olivetti dataset.
- The Olivetti faces data set 7 consists of images of 40 individuals with small variations in viewpoint, large variations in expression, and occasional addition of glasses. The data set consists of 400 images (10 per individual) of size 92 × 112 = 10, 304 pixels, and is labeled according to identity. We used
-
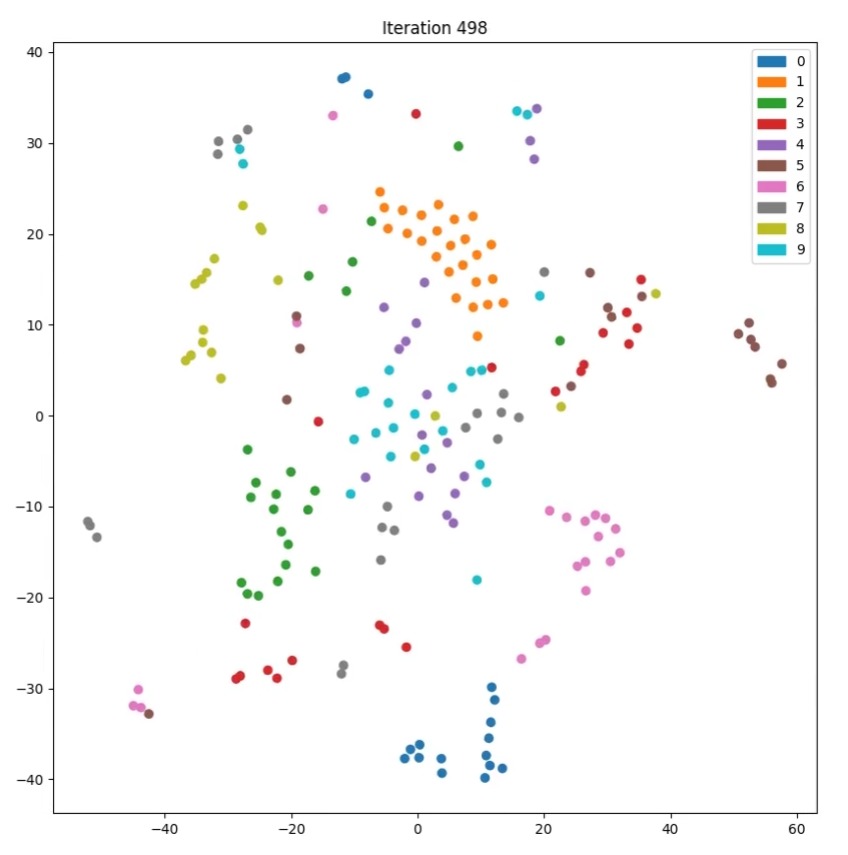
Following was the plot generated on the dataset MNIST dataset.
-
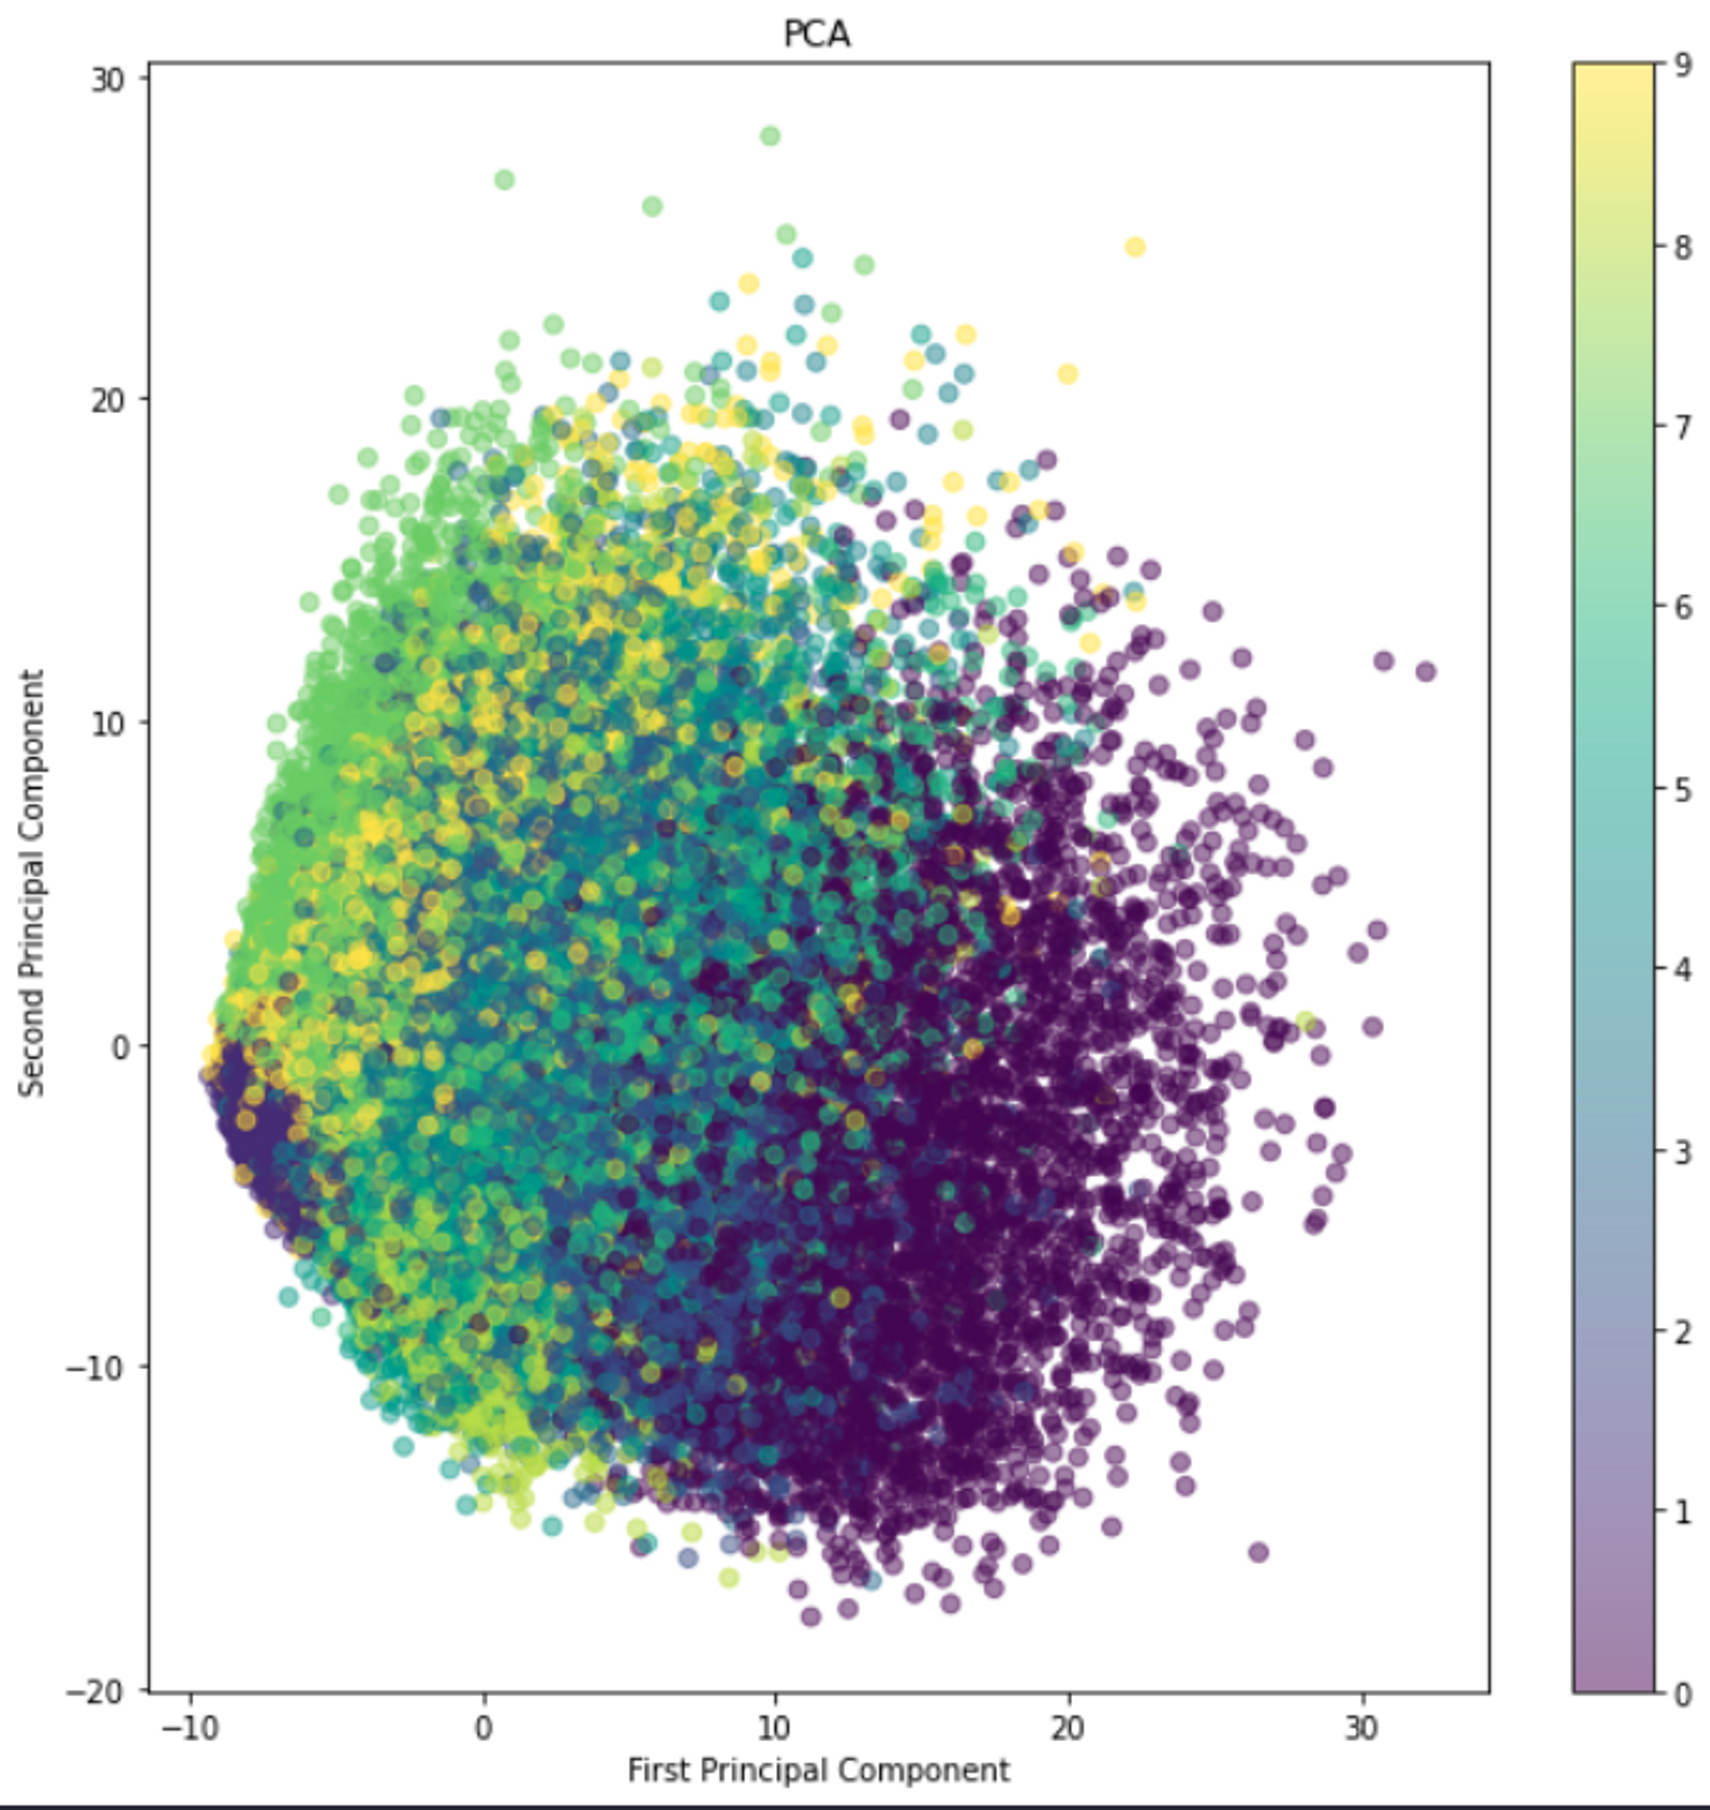
Plot generated using PCA :
-
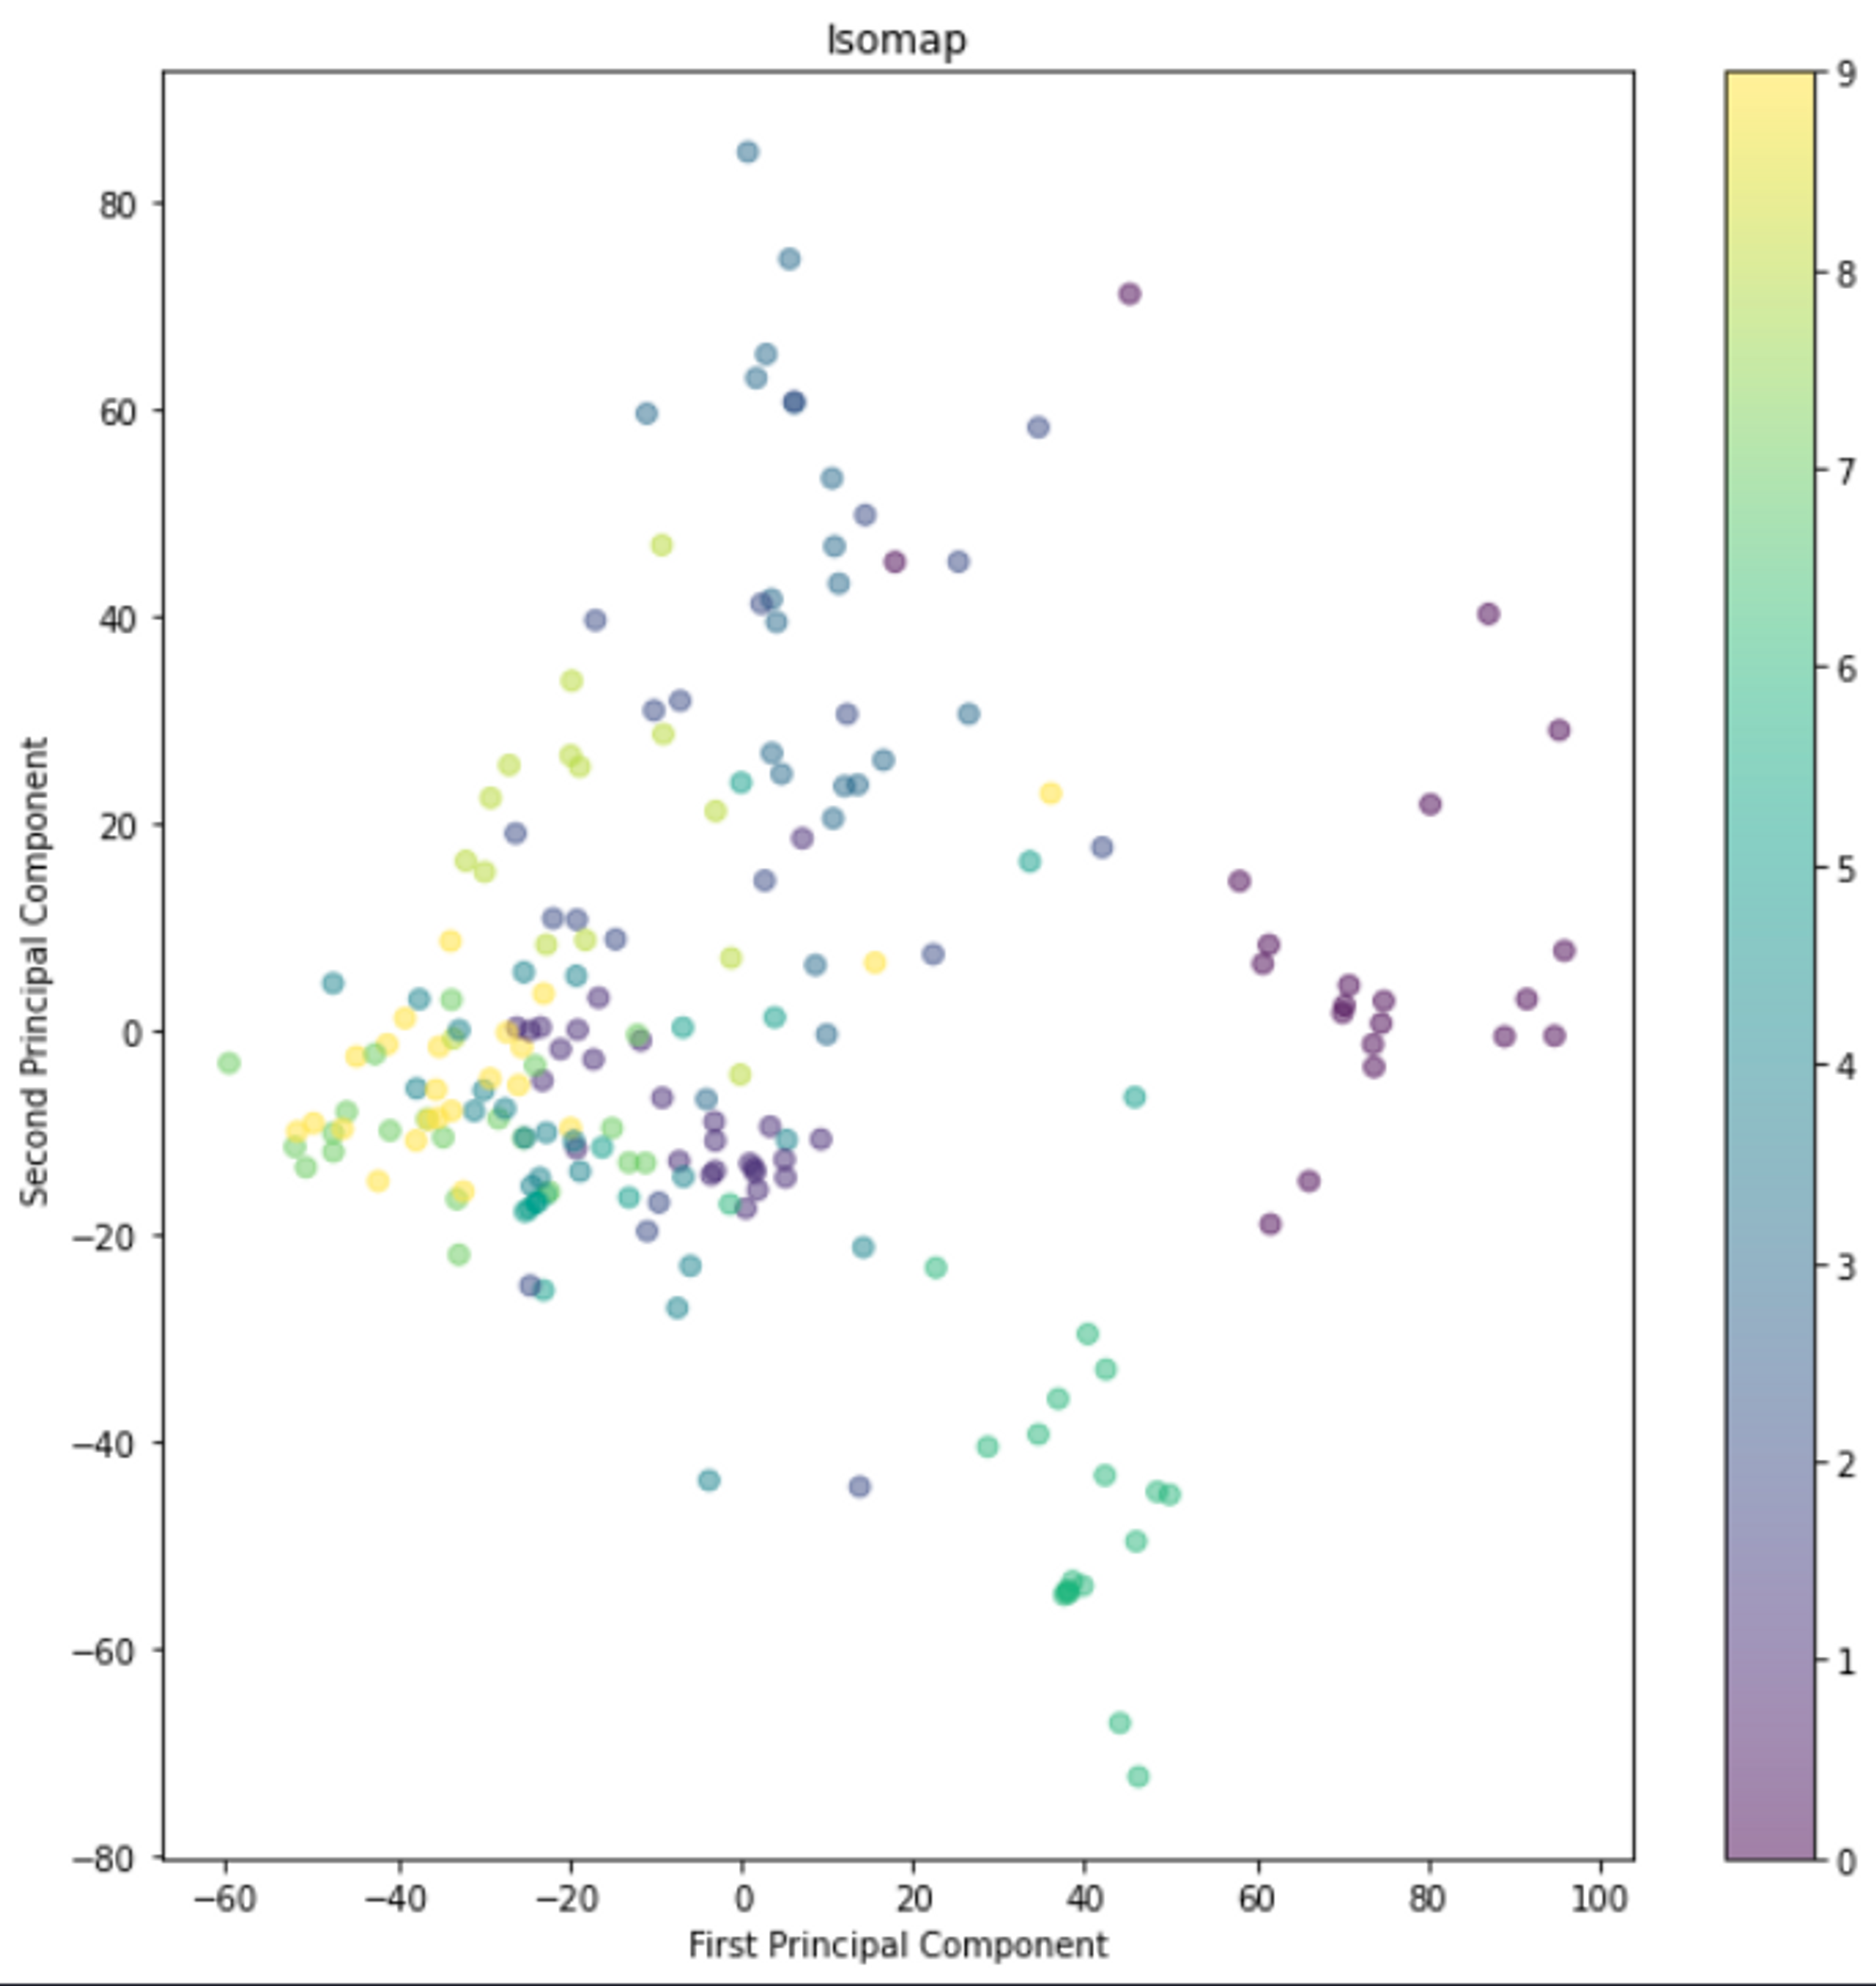
Plot generated using Isomap:
-
Seeing from our previous plots of PCA and Isomaps, we could clearly infer that the tsne technique produces better visualisation for the mnist data plots with retaining the local structure of the data samples.
We could clearly see the similar classes cluster together, while different classes tend to have a considerable separation between them even in the lower dimension projection.


-
Visualizing data using t-SNE [PDF]
Maaten, L.v.d. and Hinton, G., 2008. Journal of Machine Learning Research, Vol 9(Nov), pp. 2579—2605.
- Gaurav Singh
- Shubh Karman Singh Bhullar
- Venika Sruthi
- Karmanjyot Singh