A dashboard consisting of simple visualizations and analytics of environmental dataset using Zoho Analytics tool.
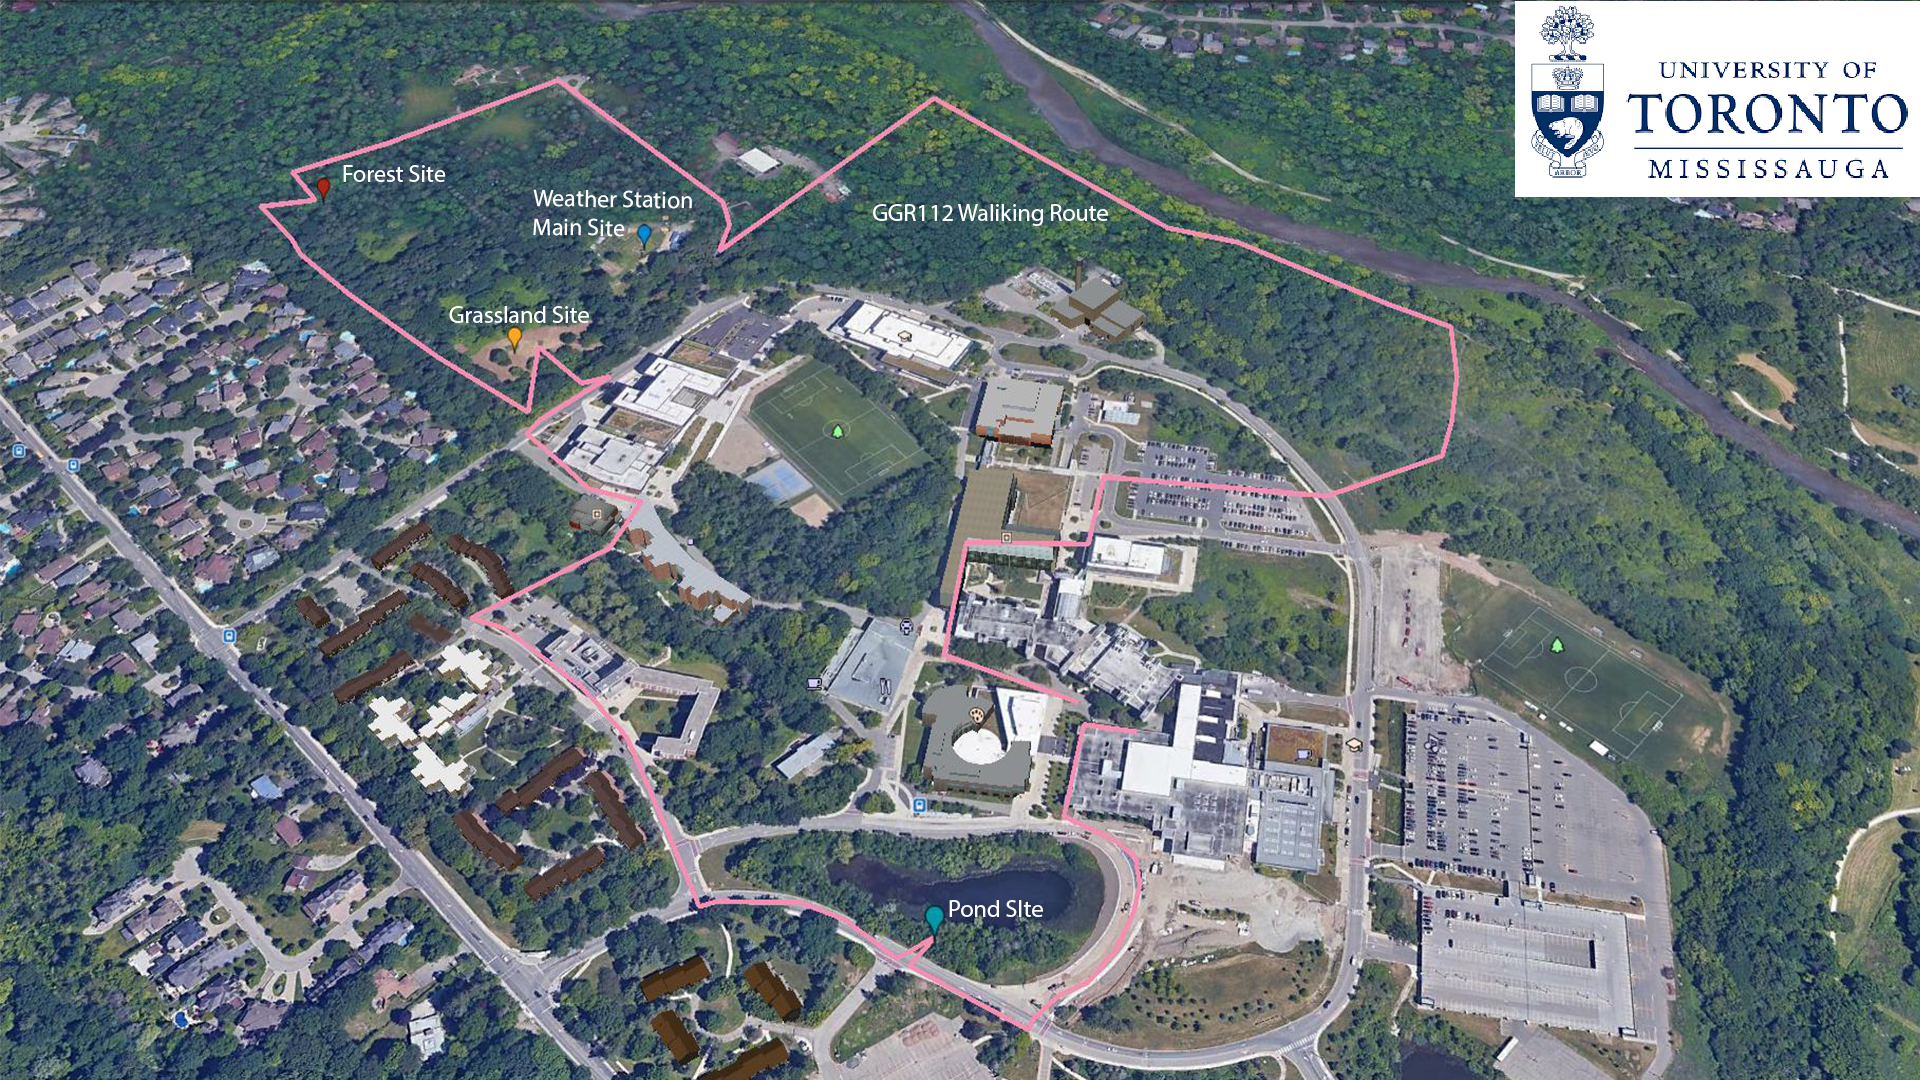
The Environmental Datasets represent measurements taken in 3 distinct environmental settings at the University of Toronto Mississauga campus. The data are separated into pond, field and forest data. Data are collected at these sites using HOBO U30 data loggers equipped with sensors monitoring soil moisture, soil temperature, air temperature and relative humidity. Data are collected hourly and downloaded monthly.
The dataset is generated and made available to the public by the Department of Geography, Geomatics and Environment, University of Toronto - Mississauga. It is available over the period October 2009 to April 2018. Individual month datasets for each year are also available.
The entire dataset can be downloaded from here.
| Column Name | Data type | Description |
|---|---|---|
| excel_datetime_code | Float | Date and time code corresponding to the recorded measurement. |
| excel_day | Integer | Day of observation |
| excel_time | Float | Time of observation (in EST). |
| field_soil_temp_c | Float | Soil temperature at the field site in degrees Celcius from a sensor buried 30cm below the surface. |
| field_air_temp_c | Float | Air temperature at the field site in degrees Celcius. |
| field_rh | Float | Relative humidity in (%) at the field site. |
| field_soil_wc | Float | Soil water content in m3/m3 recorded at the field site by a sensor 30cm below the soil surface. |
| forest_soil_temp_c | Float | Soil temperature at the forest site in degrees Celcius from a sensor buried 30cm below the surface. |
| forest_air_temp_c | Float | Air temperature at the forest site in degrees Celcius. |
| forest_rh | Float | Relative humidity in (%) at the forest site |
| forest_soil_wc | Float | Soil water content in m3/m3 recorded at the forest site by a sensor 30cm below the soil surface. |
| pond_soil_temp_c | Float | Soil temperature at the pond site in degrees Celcius from a sensor buried 30cm below the surface. |
| pond_air_temp_c | Float | Air temperature at the pond site in degrees Celcius. |
| pond_rh | Float | Relative humidity in (%) at the pond site. |
| pond_soil_wc | Float | Soil water content in m3/m3 recorded at the pond site by a sensor 30cm below the soil surface. |
A dashboard generated based on May 2016 dataset can be found here.
Data Visualization tools allow analysts and statisticians to create visual data models easily according to their specifications by conveniently providing an interface, database connections, and Machine Learning tools all in one place! some of the most widely used data visualization tools are:
https://www.geeksforgeeks.org/10-best-data-visualization-tools-in-2020/


