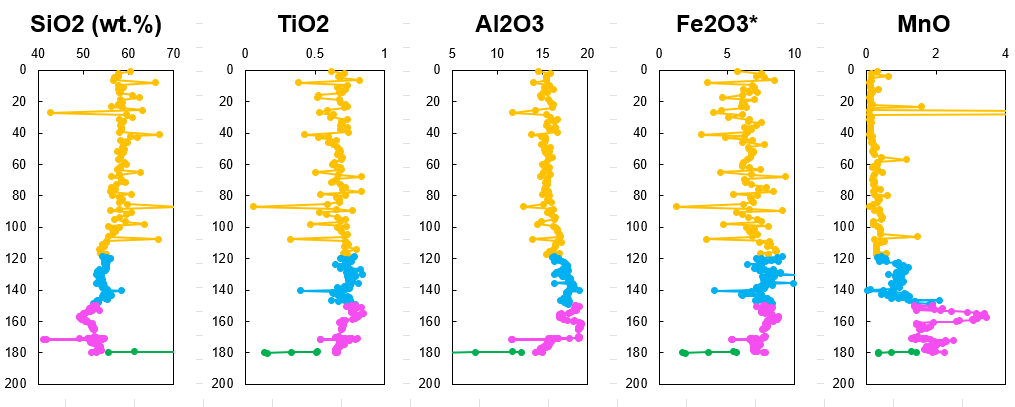
Excel VBA to generate downhole profiles and scatter diagrams
- Select CoreAnalyzer_v2_2.xlsm and download.
- Trust the excel file.
- Open file and activate macro
If you have security concerns, please see writeVBA
- Create a new worksheet (any sheet name) and paste your data. Element name should be placed horizontally.
-
In the new sheet, press ctrl + Shift + i to create input sheet.
-
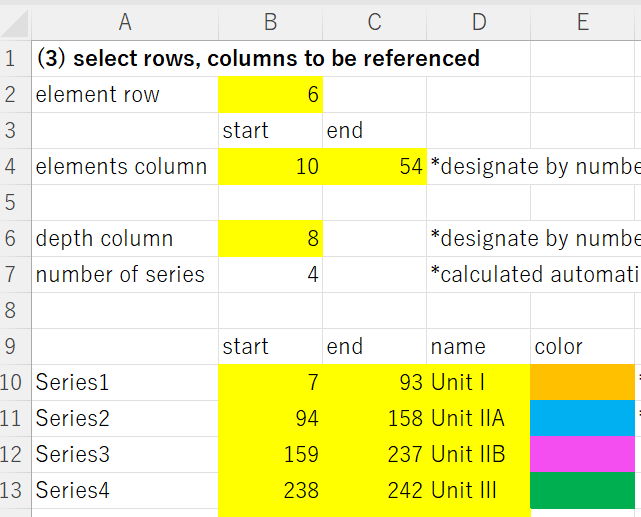
Enter information to be referenced in generating graphs in yellow cells.
-
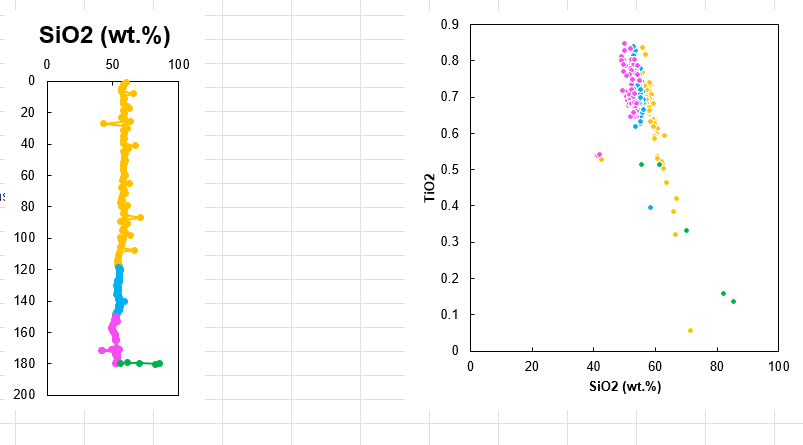
In the input sheet, press ctrl + r to create graph examples. If you want to change reference, delete both graph and press ctrl + r again.
-
Modify colors, marker types, lines of graphs as you like. The style determined here will be applied to all graphs.
- Press ctrl + t to create downhole variations of all elements.
-
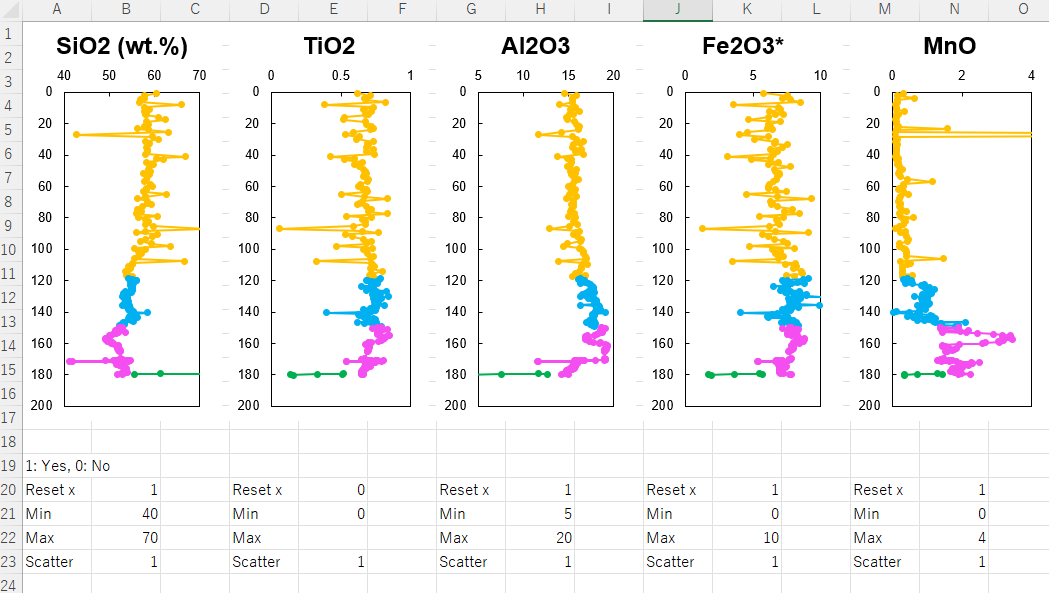
To change x-ranges, input '1' to row 20 ("reset x"), and designate minimum and maximum values. This range is also referenced when generating scatter diagrams.
-
Press ctrl + Shift + t to change xranges.
-
Input '1' for to row 23 for elements you want to generate scatter diagrams. It takes some time depending on PC spec, so please select 5-10 elements at the first time.
-
In the worksheet of downhole profiels, press ctrl + n to create scatter diagrams.
- (optional) If you want to change information in the input sheet, modify and press ctrl + Shift + n
- 2019.3.8 Version 1
- 2019.4.7 Version 2
- 2023.12.3 Publish (version 2.2)


