This code performs an unsupervised machine learning algorithm: K-Mean Clustering.
We support any data with at least 2 dimensions, while visualization is available for 2 dimensional data.
Tested on Python 3.9, but it should work on any Python with version 3.X.
Numpy: For basic calculation. Matplotlib: For visualization. Seaborn: For color palettes. Scipy: For convex hull calculation.
Sample 2D and 3D data are provided.
To use 2 dimensional clustering, input your data as an (N,2)-shape numpy array in visual_2d.py.
Change the number of clusters K if needed.
Then run the script
python visual_2d.py
You will see some visualizations.
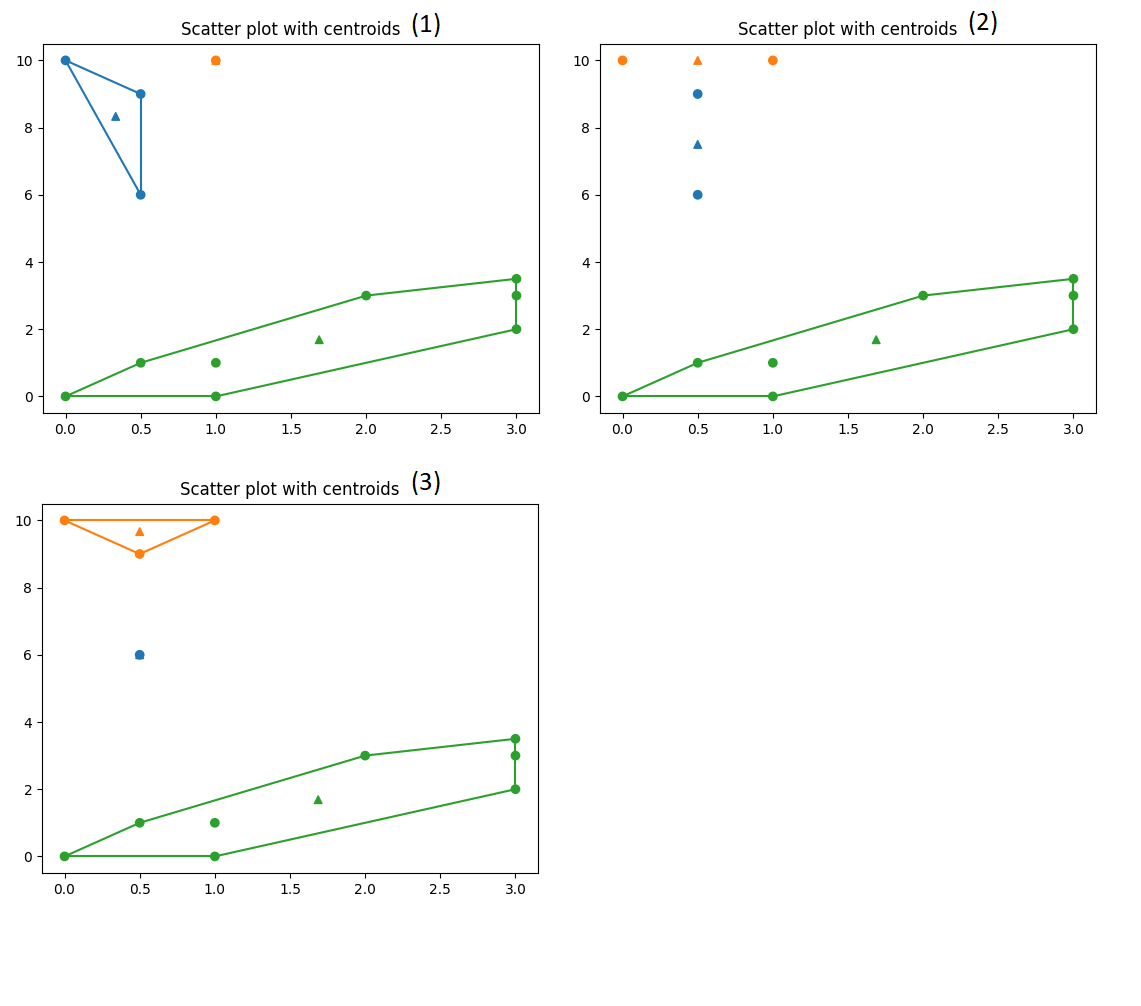
Dots are the sample points, and triangles are the centroids for the groups..
Finally, the output will show you a zero-base indexing, indicating the cluster each point belongs to, and a (K,2)-shape numpy array for the centroids.
Here we show the iteration process
To use data that is at least 3-dimensional, edit the input similarly in calc_nd.py.
Currently there is no visualization for this kind of data, but we will still output the data-cluster relation as a zero-based index, and the list of centroids.
