A Visual Landmark Annotation Tool
This simple GUI tool makes landmark annotation task easier. After finishing the annotation, it will export a CSV file as a result. User may use it for other purposes.
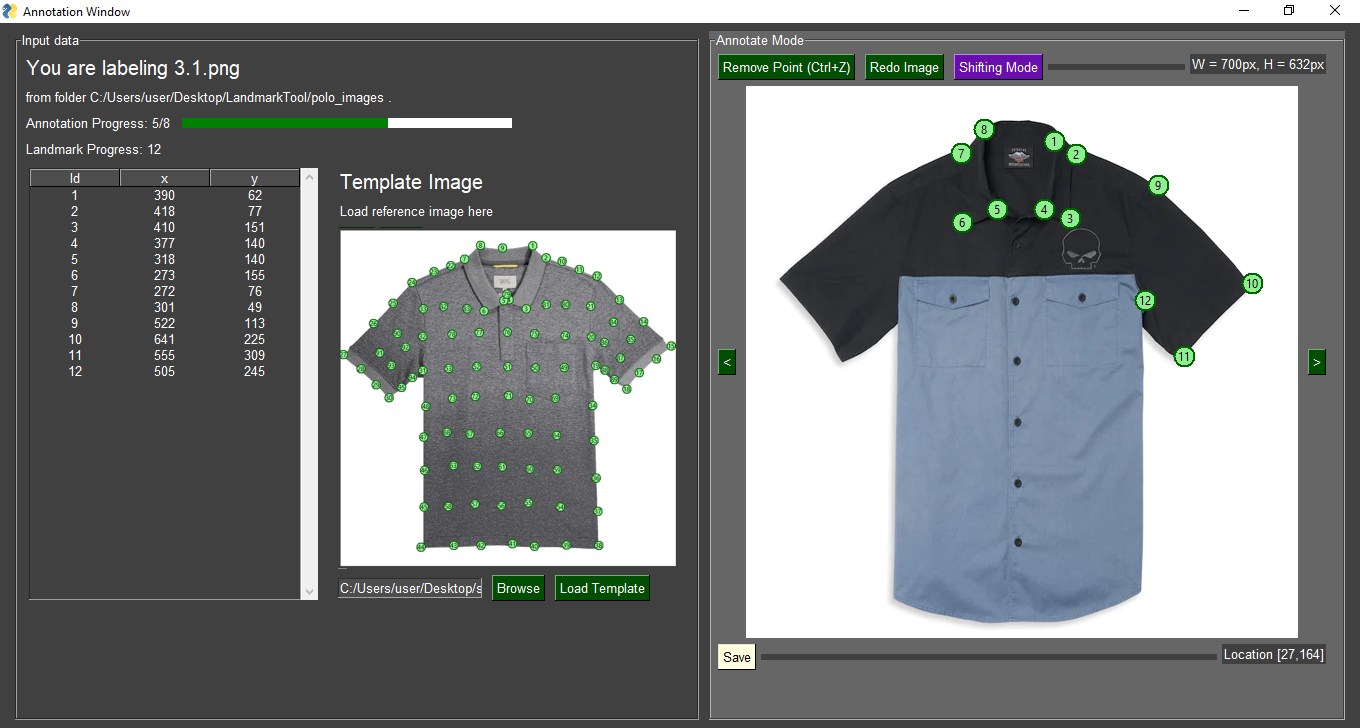
By using this program, we eliminate minor chores such as navigating Excel files, open up Image Editor, look at coordinate of the cursor then copy it into the Excel file again. Instead, users only need to spend most of their time clicking points on the images, since it is the only process needing human supervision. The program will handle data saving, image navigations and other useful features for the users. Moreover, this program helps reduce human errors because it will show a good visualization of the labeling, preventing events like mistype coordinate or accidentally swap two coordinates.
Therefore, if you think adding some new features will help us moving toward this objective, please do not hesitate of suggesting it.
- Added "Shifting Mode", so user can adjust the location of any landmark, not just the last landmark. It is purple themed, so everything purple colored is related to Shifting Mode.
- Added multiple monitors support. The annotation will be opened in the second monitor if the user has multiple monitors enabled.
After cloning the repository, run
pip install -r requirements.txt
Then the program should be working fine.
This program is developed on Windows 10, Python 3.9. Please open an issue if encounter any problem.
The logic of this tool is developed entirely in Python. User interface is developed with PySimpleGUI, a simple to use GUI development tool.
Use our sample folder polo_images/ for illustration.
Run
python app.py
An interface will pop up.
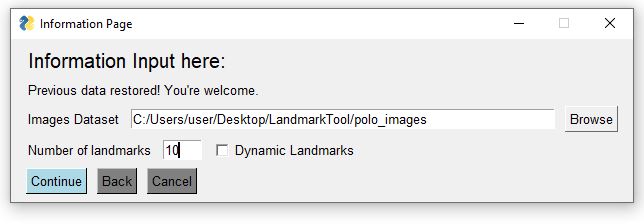
Follow the instruction, choose the polo_images/ folder and enter 10 landmarks, then start annotate the images.
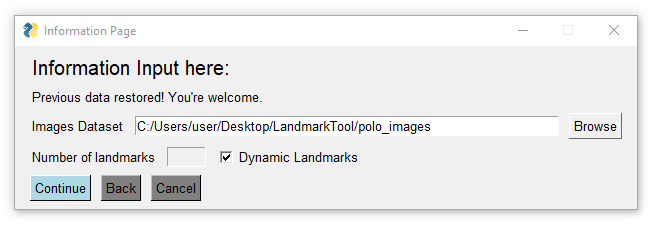
If the user need to label the data without a fixed number of landmarks (such as anomalies in medical images), enable the "Dynamic Landmarks" option.
Start labeling now and enjoy the simplicity!
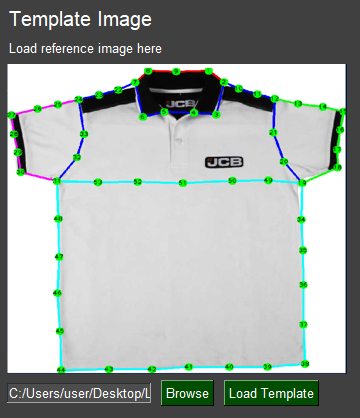
It is possible to load a reference image, this is to spare user the hassle to remember how to label the landmarks from time to time.
We will record the landmark coordinates into annotation/polo_images.csv, which is a CSV file.
The CSV file name is taken from the dataset's folder name.
Column names format will be image_name,x1,y1,x2,y2,....
Note that image_name is the base-name of the image file, its parent directory name is not used to avoid data duplication.
The x,y coordinates are recorded with top-left origin, which means the top-left corner of the image is recorded as 0,0.
| image_name | x1 | y1 | x2 | y2 | x3 | y3 | x4 | y4 | x5 | y5 |
|---|---|---|---|---|---|---|---|---|---|---|
| 1.1.png | 398.0 | 37.0 | 414.0 | 56.0 | 369.0 | 130.0 | 364.0 | 99.0 | 292.0 | 47.0 |
| 115.1.jpeg | 391.0 | 256.0 | 405.0 | 274.0 | 383.0 | 336.0 | 339.0 | 331.0 | ||
| 2.1.png | 506.0 | 100.0 | 605.0 | 218.0 | 504.0 | 305.0 | 483.0 | 283.0 | 391.0 | 28.0 |
| 29.1.jpg | 409.0 | 71.0 | 388.0 | 81.0 | ||||||
| 29.2.jpg | ||||||||||
| 3.1.png | 384.0 | 50.0 | 409.0 | 69.0 | 399.0 | 148.0 |
Notes: In the Dynamic Landmark style, we will find out the maximum number of landmarks used from every image, then build the CSV file using the number.
Other images with less landmarks will be filled by blankspaces, as illustrated from the table above.
Moreover, user can also import CSV file using this format, then the program will load the data from the CSV file.


