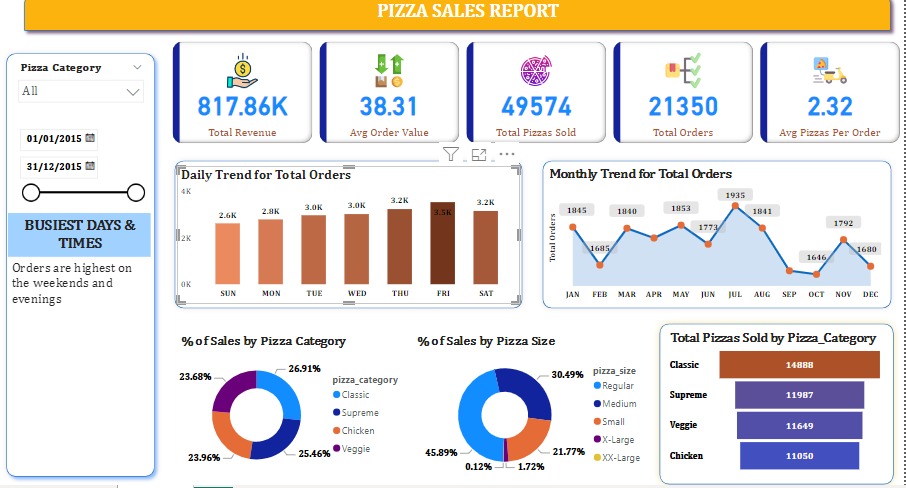
Welcome to the Pizza Sales Analysis project. This analysis dives into the fascinating world of pizza sales, offering valuable insights into revenue, order patterns, and customer preferences. Using Power BI, I've transformed raw data into engaging visualizations that tell the story of pizza sales journey.
Here are some of the key findings from our analysis:
a) Total Revenue: Our pizza sales generated a total revenue of $817,860.05, making it a significant contributor to our business.
b) Average Order Value: On average, each order was worth $38.31, showcasing our ability to provide value to our customers.
c) Total Pizza Sales: We sold a total of 49,574 pizzas, a testament to the popularity of our products.
d) Total Orders: We processed 21,350 unique orders, reflecting a high level of customer engagement.
e) Average Pizza per Order: Customers ordered an average of 2.32 pizzas per order, indicating a strong appetite for our offerings.
To bring these insights to life, I've created interactive visualizations using Power BI. The reports include charts, graphs, and dashboards that allow you to explore the data in a user-friendly manner. Dive into the Power BI report to experience the full spectrum of our findings.
This analysis is based on a comprehensive dataset that contains rich information about pizza sales. It serves as the foundation for data-driven decisions and insights.
To explore the results of our analysis and delve into the visualizations, simply access our Power BI report. It's designed to provide a seamless and engaging experience for users interested in our pizza sales story.
