Data Expenses
My attempt to pierce the secret of long term savings! A data expenses manager which takes .CSV as input and categorize expenses.
TODO
- Make labels configurable from within the application
- Create a cache of data calculated using SQLite to prevent the wasteful recalculation of all data
- Embed the spa into Electron to provide an easy way to install the application
- Move charts to Plotly
Why am I doing this?
There are a lot of expense managers already. Those are centered around money earned versus money spent. While it is great for tracking expenses and managing budgets, it isn't great in correcting expense behaviours in long term. A deeper analysis must be done to discover habits and behaviours in individuals.
I believe that the best way to analyze your expenses is to do it yourself. In order to create good analysis, one needs to be intimate with the data. You must know the data and understand it clearly which requires a lot of time. Fortunately, I am intimate with my own expenses therefore I am creating this application with the goal of finding patterns and behaviours which I can correct for long term savings!
Questions yet to be answered and ideas to be implemented
Is there a correlation between:
- the number of transactons and full amount per month?
- the amount spent and the next amount spent directly under the same category?
- the time gap between the previous transation and the amount spent?
- the velocity of the spending at the beginning of the month and the total spent?
- the velocity of the spending at the end of the month and the total spent?
Ideas to implement:
- Have the data computed on refresh and save into SQLite. Subsequent query will get the data directly from SQLite.
Ideas implemented
- Check every month spending progression. By comparing it all on one graph, it can detect irregularity in the daily amount spent - Use expanding sum per category and plot all months. 10-07-2016
- Add a plot to visualise the expanding sum of all expenses of the month 17-07-2016
- Use Least square linear regression to provide an estimate of the rest of the month 17-07-2016
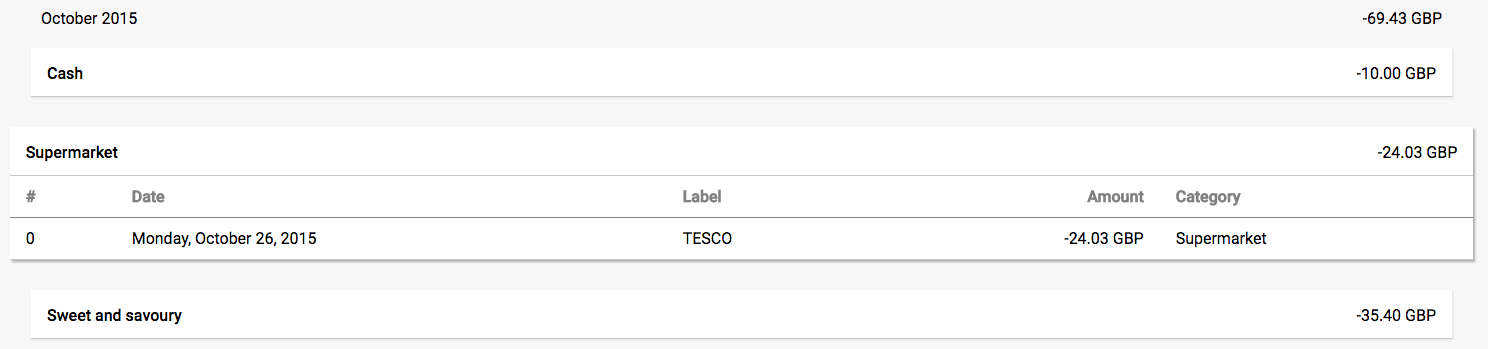
1. Expenses breakdowns
1.1 Monthly breakdown
Monthly breakdown of expenses grouped by categories.
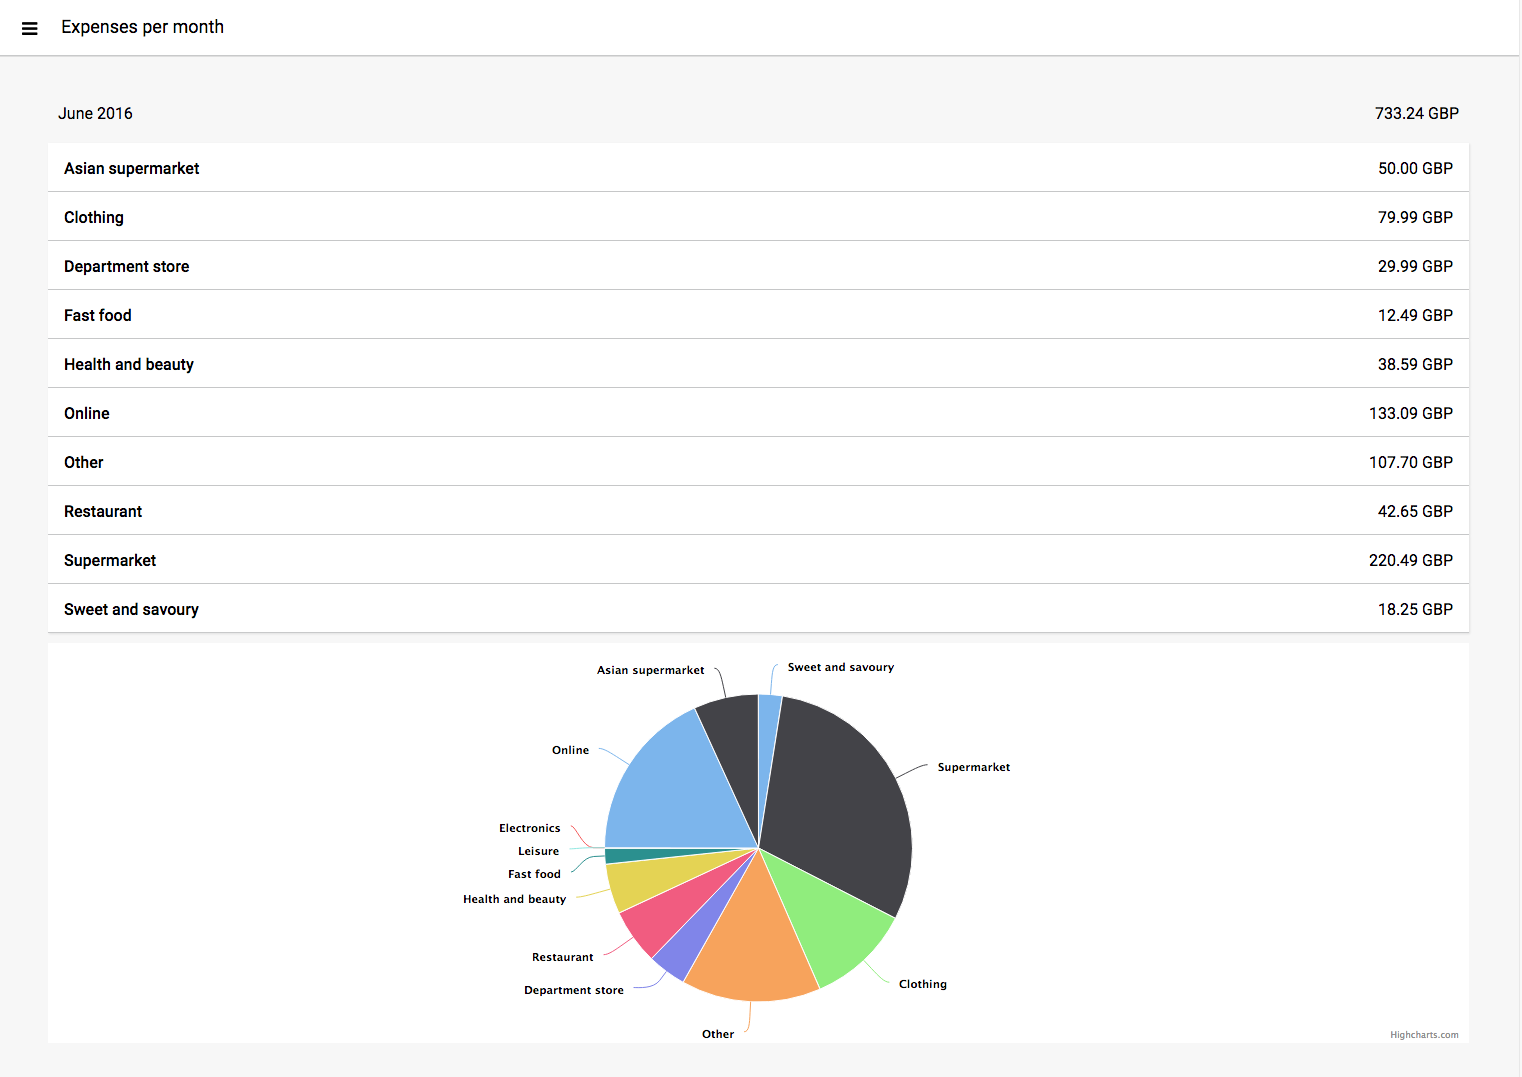
Each category can be expended to view grouped expenses.

What's the purpose?
Look at the repartition of the expenses over the time. Monitor the evolution of the spending in each category. Check if a certain category dominate the spendings. Detect irregularity in certain category.
1.2 Category breakdown
Category breakdown of expenses grouped by months.
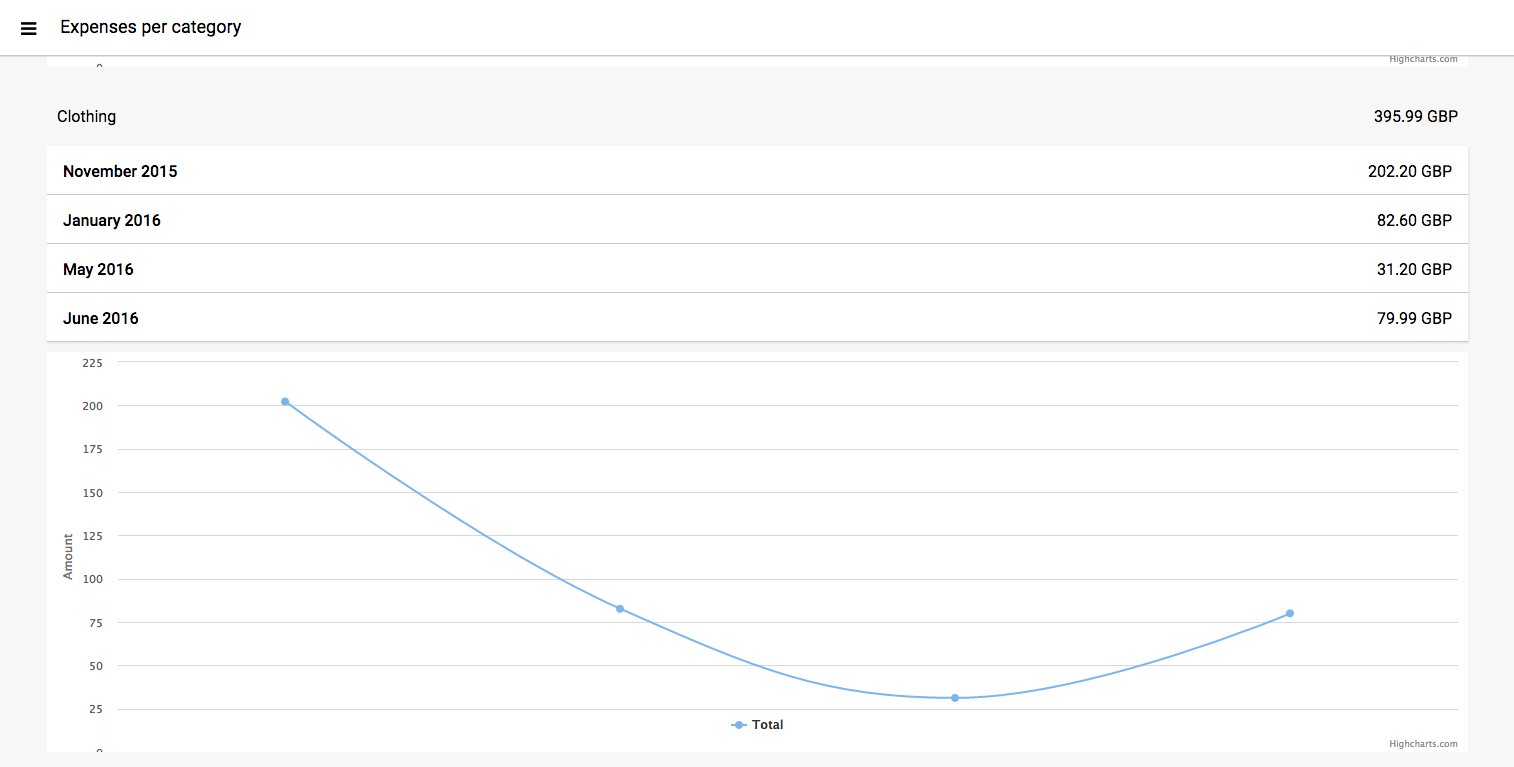
Each category can be expended to view grouped expenses.

What's the purpose?
Look at the evolution of a category spending over time. Detect irregularity for a particular month. Visualise trend. Approximate future spending (linear regression).
1.3 Shop breakdown
Monthly breakdown of expenses grouped by shops (label).
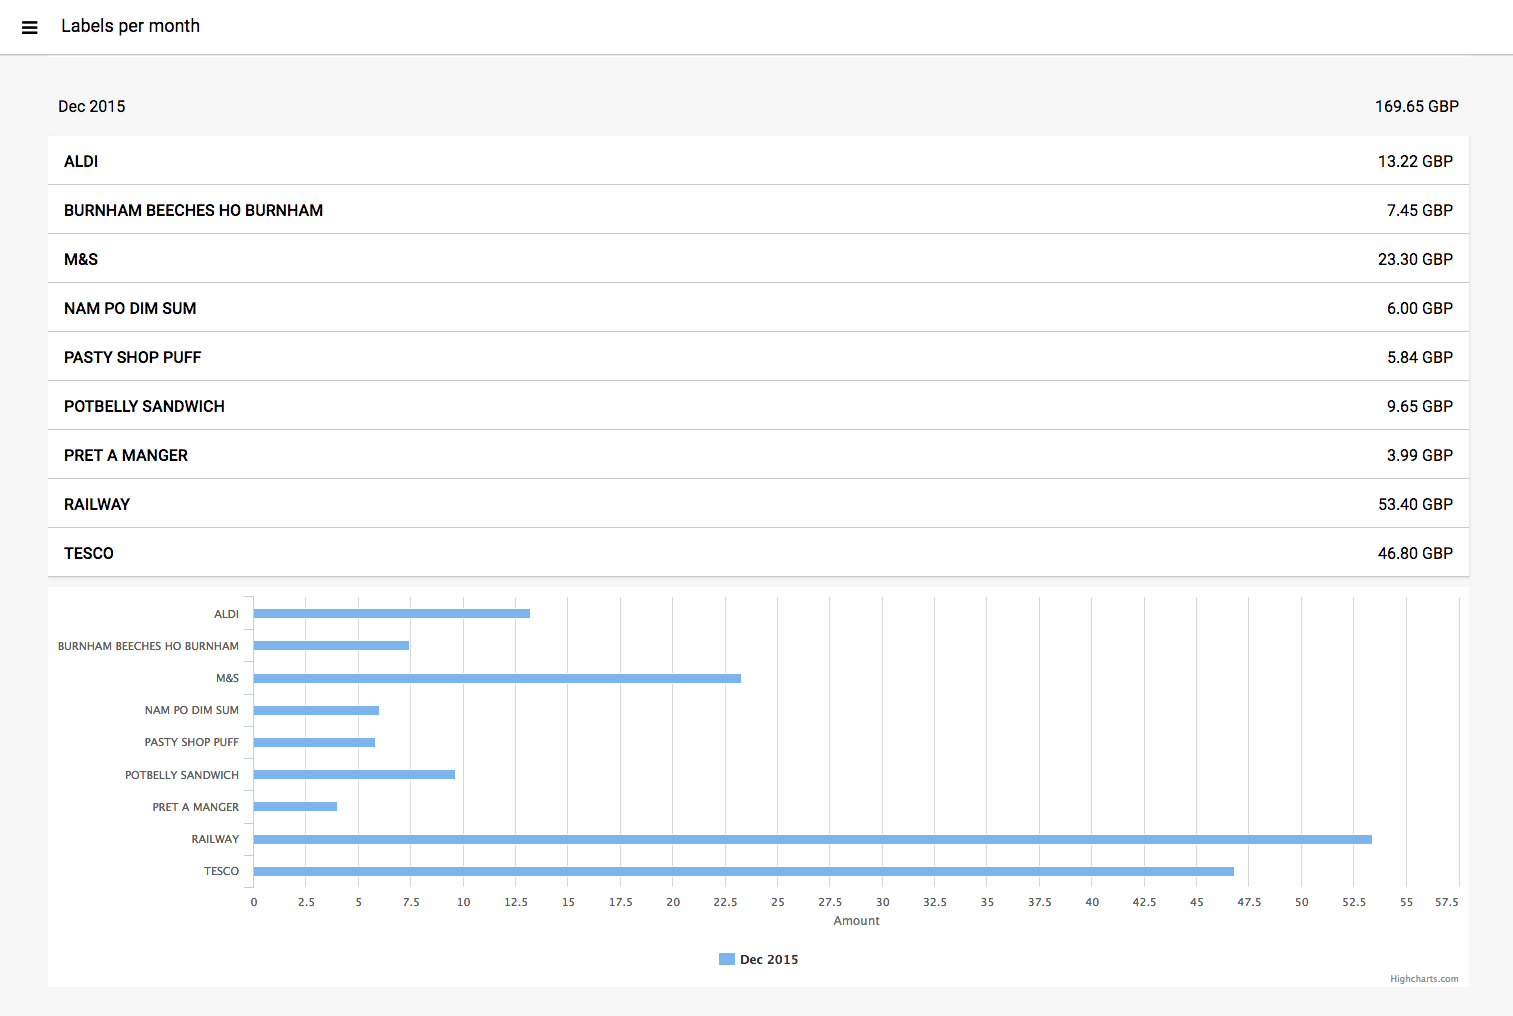
Each category can be expended to view grouped expenses.
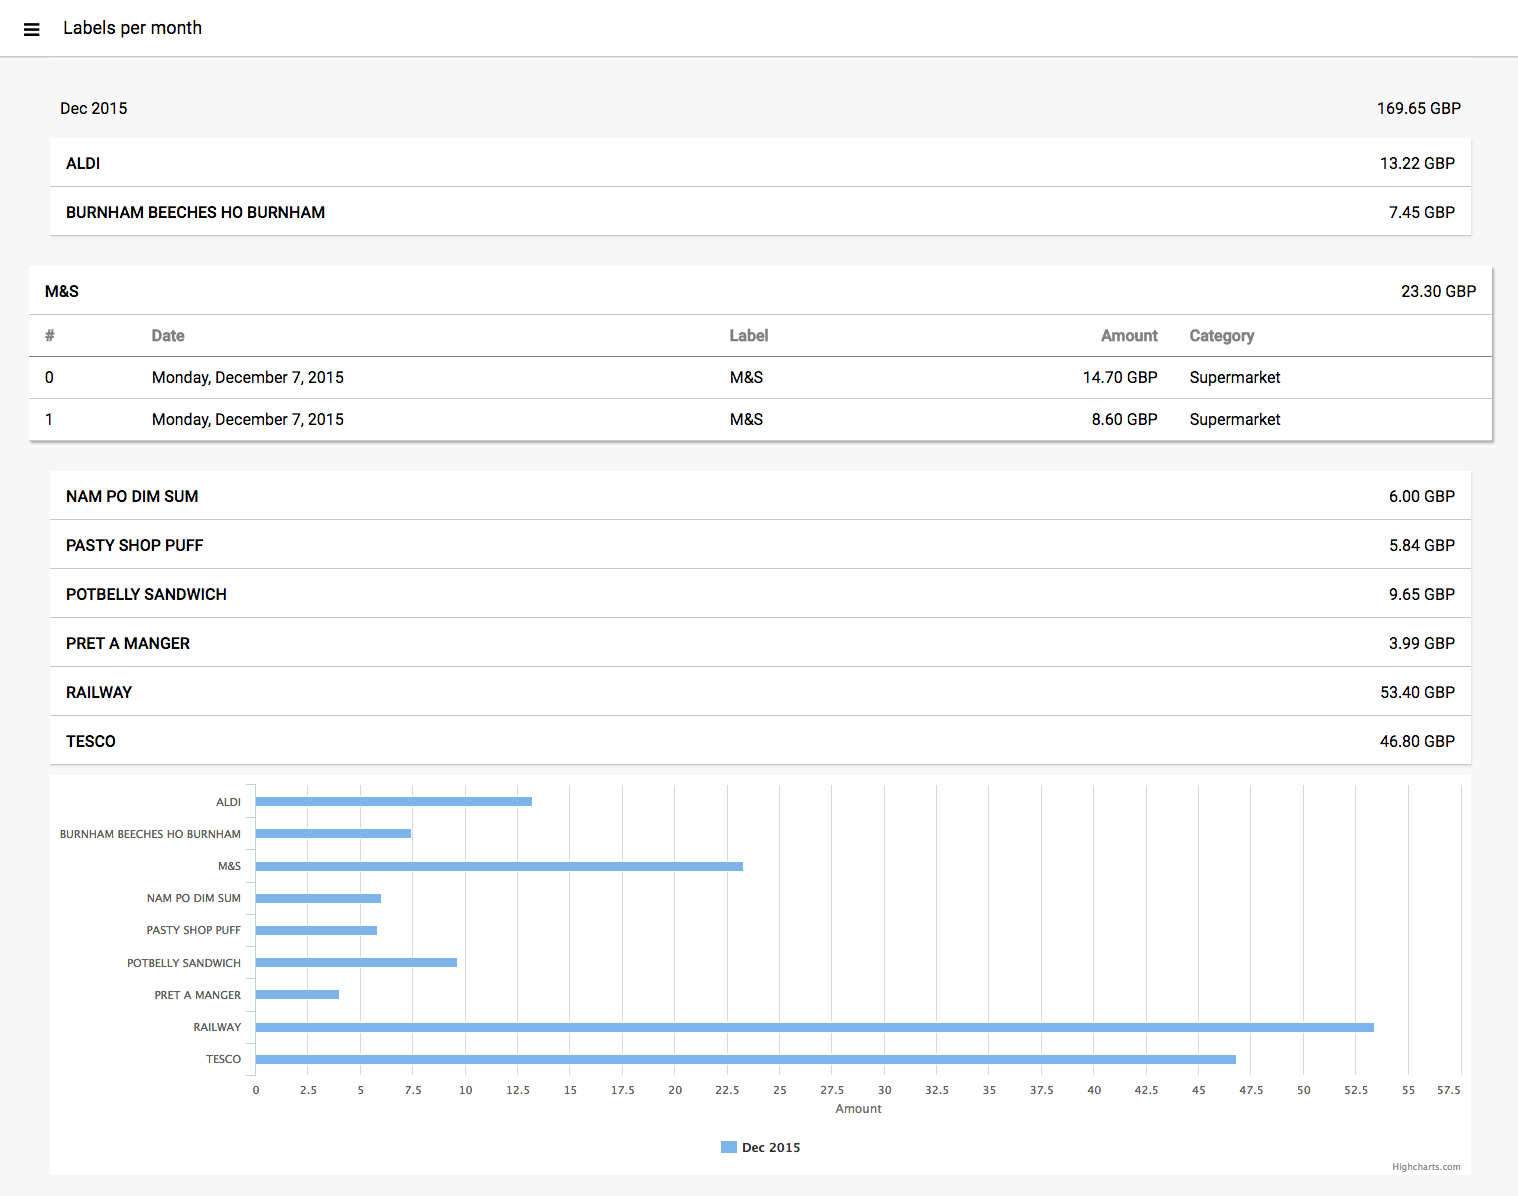
What's the purpose?
Look at the repartition of the expenses over the time. Monitor the evolution of the spending in each category. Check if a certain category dominate the spendings. Detect irregularity in certain category.
Pie chart vs Bar chart: Bar gives a better indication of the amount while Pie gives a view of the repartition. In the context of shops, I am more interested to visualise the actual amount per shop therefore having them side by side ease the comparaison.
2. Analysis
In developement...
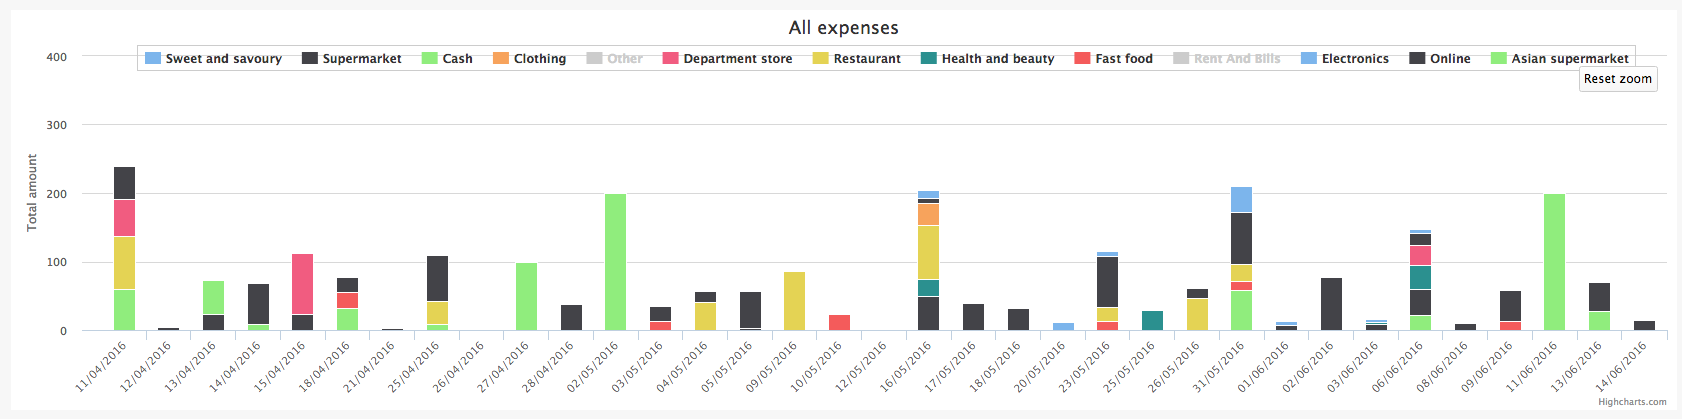
2.1 Monitor expenses over time
View your expenses stacked over time.
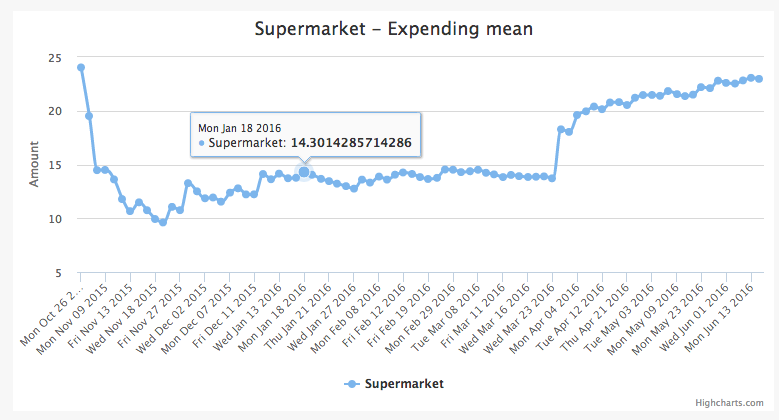
2.2 Monitor the evolution of your expense on a certain category with expanding average
Expanding average calculates the average from inception till x.
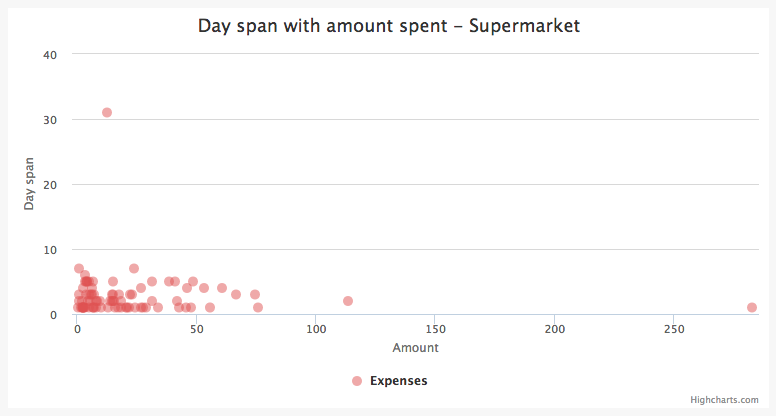
2.3 Visualize amount spent against day intervals
Experiment - Used to see trends with the hypotheses that one will spend less frequently after paying a higher amount.
2.4 Monitor the expense ratio of each category
Ratio of expenses per month for each category.
2.5 Drilldown to the expenses
Lookup for a particular expense through the list.
3. Predictions
In development...
Stack
Built with:
- F#
- WebSharper
- Deedle
- Highcharts
- SimpleUI - my UI framework https://github.com/Kimserey/SimpleUI
Related: