“A computer program is said to learn from experience E with respect to some class of tasks T and performance measure P, if its performance at tasks in T, as measured by P, improves with experience E.”
Tom M. Mitchell
The goal of the project is to train a program to guess the price of a car given its kilometrage. It's a simple linear regression problem.
Make sure to have a Python >= 3, with os, argparse, logging, numpy, imageio and matplotlib installed.
Make sure you have the file "./data.csv" - or specify your .csv file.
To train the model based on the dataset:
python3 training.py python3 training.py -h
options:
-h, --help show this help message and exit
--f F Input data file as .csv
--t0 T0 Initial value for theta0
--t1 T1 Initial value for theta1
--lr LR Learning rate
--mi MI Maximum number of iterations
--ep EP Convergence threshold for epsilon
--gif Generate GIF of iterations
--show Show plotsTo make a prediction based on the dataset:
# If the model has already been trained ("./raw_thetas.csv" file should exists)
python3 prediction.pyUsing the makefile, this will run both scripts with base values:
makeRun both scripts with training.py arguments:
Here I'm setting a target file, learning rate to 0.01, max iterations to 1000, --gif to create a GIF to help vizualisation, and --show so I can see the differents plots during the process
make ARGS="--f=data.csv --lr=0.01 --mi=1000 --gif --show"
Run the training script without params:
make trainingRun the prediction script:
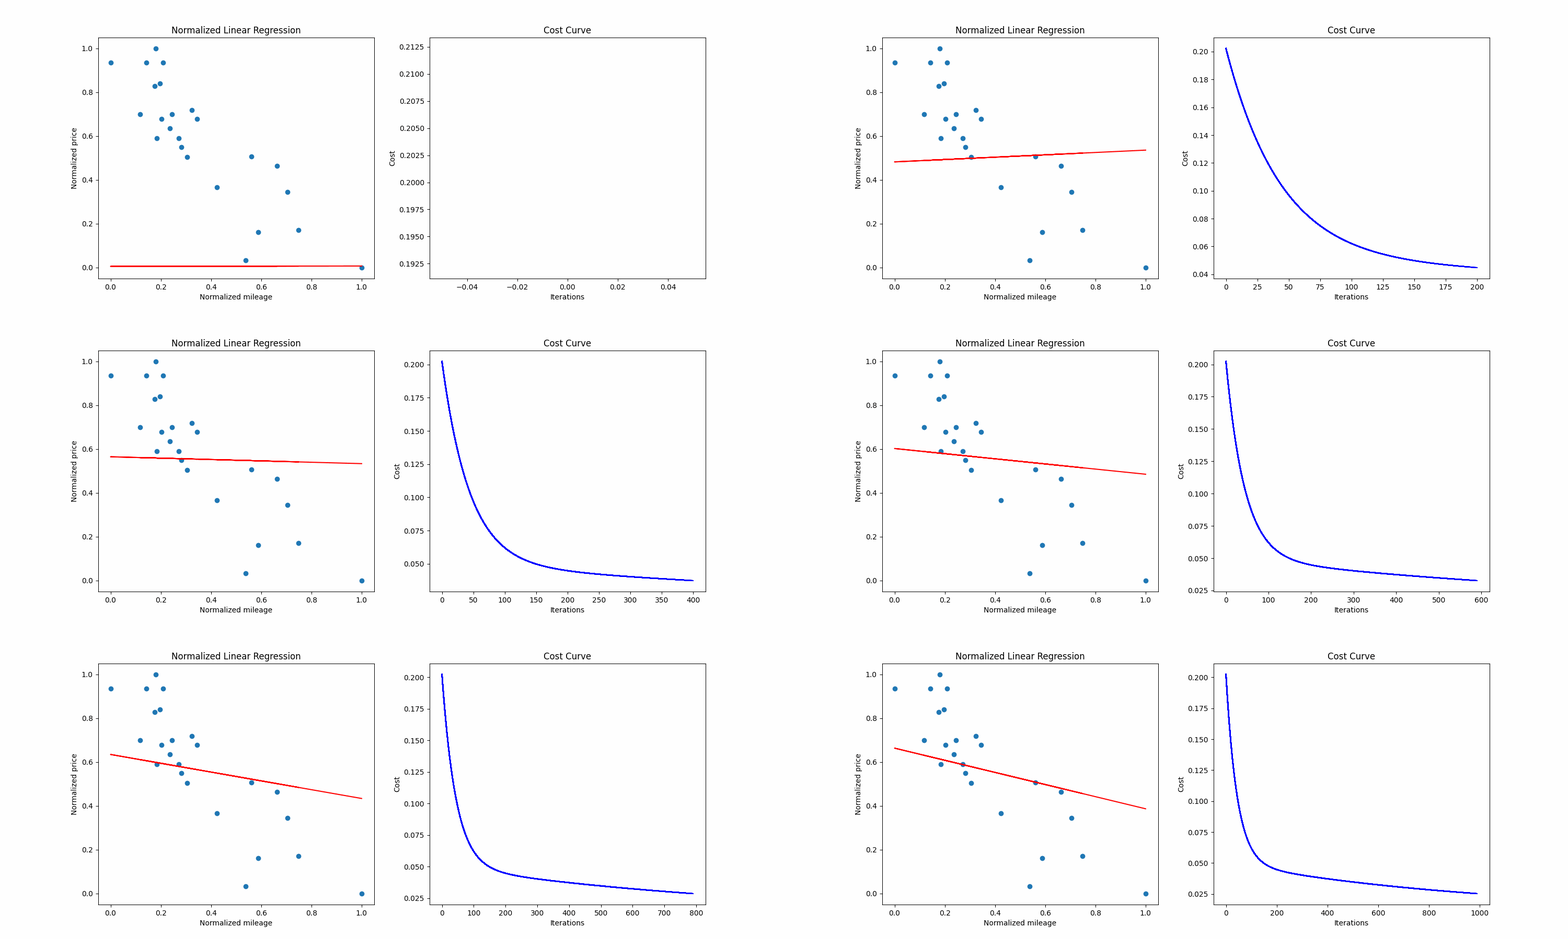
make prediction Above is a normalized visualization of the dataset, with the cost curve on the right side.
Linear regression is the process of finding a line that best fits a given dataset.
In this project, it had to be done with the gradient descent algorithm. You can define "finding the line that best fits M examples" by "find the line that reduces the average distance between the data points and itself". Gradient descent is an algorithm that looks at every examples, and adjusts the line a little bit to fit better.
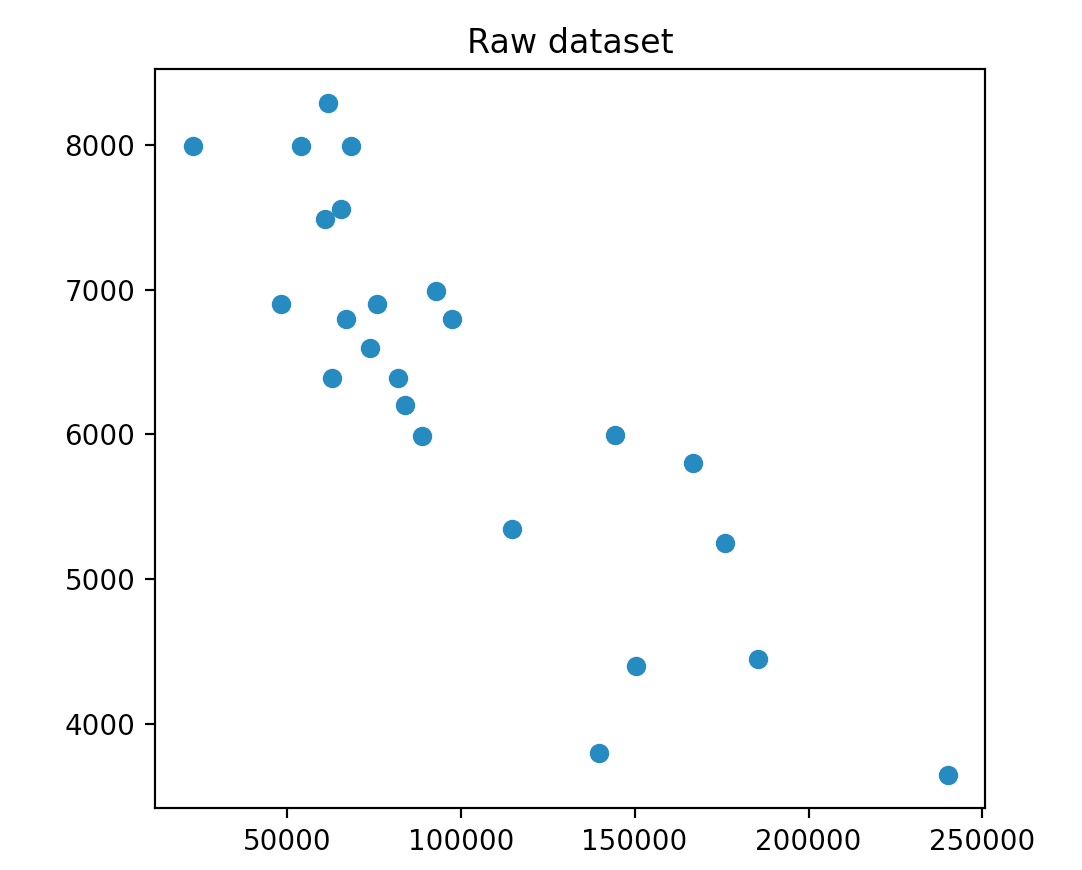
You can use pyplot to visualize data in Python. Here we have a 2D dataset, so we use the scatter function. Here is what we get:

We can see that the axis have a really different scale. In general, machine learning algortihms work best with unskewed data, so what we can do is normalizing our data, to constrain every example between 0 and 1 on both axis.
We can expect that our theta0 should be around 8000, and our theta1 should be a small negative value. It will help us know if what we'll get is good or not.
Our line is defined by two parameters, theta0 and theta1:
# x = mileage
estimated_price = theta0 + theta1 * x
Now we use the gradient descent algorithm to find the best parameters.
Here what's the training looks like on my side, with 1000 max iterations, a learning rate of 0.1 and epsilon of 1e-6:

At the end of the training and after converting the values back to the original scale, the training.py script gives me this output:
Raw theta0: 8366.708243351111, raw theta1: -0.020185129175923234, saved to ./raw_thetas.txt
Plot using raw data saved to ./images/linear_regression.png

Base input file: data.csv
Base values:
    Learning rate: 0.1
    Max iterations: 1000
    Epsilon: 1e-06

Normalized values:
    Normalized theta0: 0.9169157263688892
    Normalized theta1: -0.9444421830220066
    Precision: 95.70434
    Cost: 0.010448846836099734
Iterations: 602
We now have our line that minimizes the average distance with examples.
We can plot it on our dataset to see if our values seem correct:

The line seems good, and now we can do predictions by reading on the line, or by using the formula given previously.
make ARGS="--f=data.csv --lr=0.01 --mi=1000 --gif --show"
Welcome to the Linear Regression Car Price Estimator!

Raw thetas file already exists. Do you want to run the program again? (y/n): y
Starting linear regression training...
Gif will be saved to ./images/animation.gif
Gif saved to ./images/animation.gif
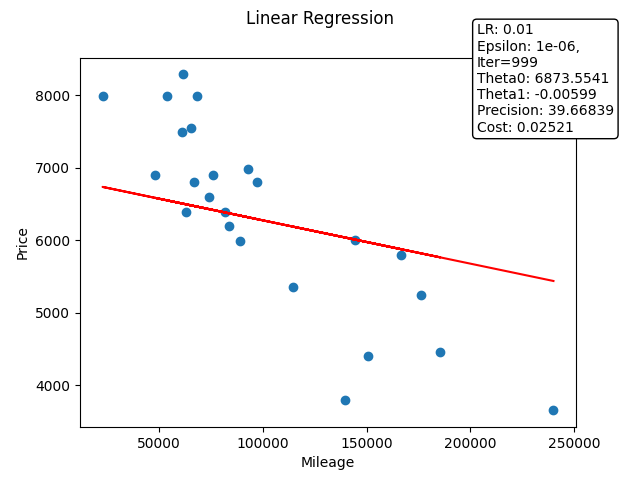
Raw theta0: 6873.554104493563, raw theta1: -0.005985084305916514, saved to ./raw_thetas.txt
Plot using raw data saved to ./images/linear_regression.png

Base input file: data.csv
Base values:
    Learning rate: 0.01
    Max iterations: 1000
    Epsilon: 1e-06

Normalized values:
    Normalized theta0: 0.6651943230543922
    Normalized theta1: -0.2800361611850822
    Precision: 39.66839
    Cost: 0.025208990561674628
Iterations: 999
Please enter a mileage...
Enter mileage: 345
Estimated price for 345km: $6871.489
As you can see the given outputs are pretty bad, the precision is way too low and the regression line did not converge.

