This is a project in which I run a simulation of the birthday problem.
What is the probability that in a set of n randomly chosen people at least two will have the same birthday?
According to theory, the probability will be approximately 1 for a group of sixty people. A formula used to calculate the theoretical probabilities is
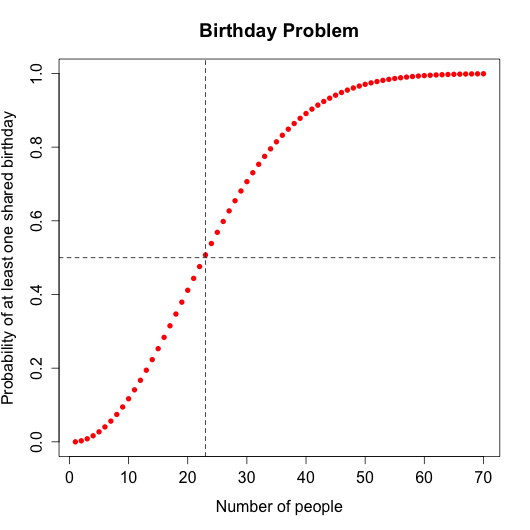
The horizontal dashed line is drawn at a point 0.5 and the vertical dashed line is drawn at a point 23. In other words, the theoretical probability of a shared birthday in a group of 23 people is approximately 0.5 or 50%.
I calculated the theoretical probabilities in Mathematica. The Mathematica notebook and the csv file with theoritical probabilities are in the Mathematica folder.
I run the simulation and analysis in bdayProblem.R script. The function bdayProbs() is the actual simulation. It takes two arguments:
- number of people
- number of trials
For example, bdayProbs(60,25) will return a dataframe of probabilities of a shared birthday in group of all sizes up to 60 people. The group of each size will be drawn 25 times. The function will record each time a group had a shared birthday, and then divide the number of times a group had a shared birthday by the number of trials that is by 25. In other words, we get a fraction of times the group had a shared birthday which is in essence the probability of a shared birthday in a group.
The simulated probabilites for 25, 100, and 1000 trials as well as theoretical probabilities are in a graph below.
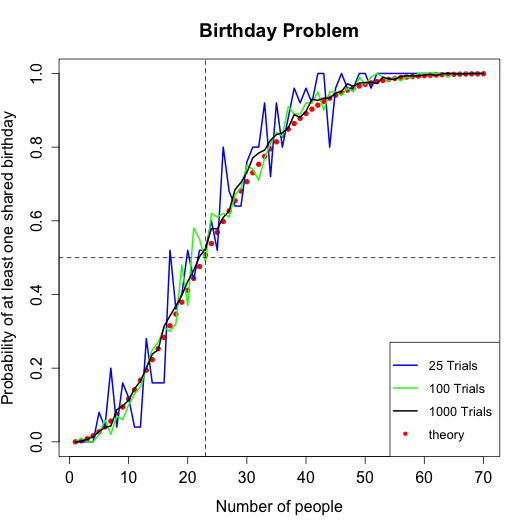
We can see that the simulated probabilities approach the theorietical probabilties as the number of trials is increasing. Therefore, theory is backed up by the simulated data. So, in a class of sixty people (probably a lecture) there is 99.9% probability that at least two people share a birthday.
Another way to describe it (thanks Amit!): if there are 2 people in a room, there is a 364/365 odds they don't share a birthday. If there are 3 people in a room, there is a 363/365 odds they don't share a birthday. so you multiply each of those odds until you hit the percentage chance of two people sharing a birthday.