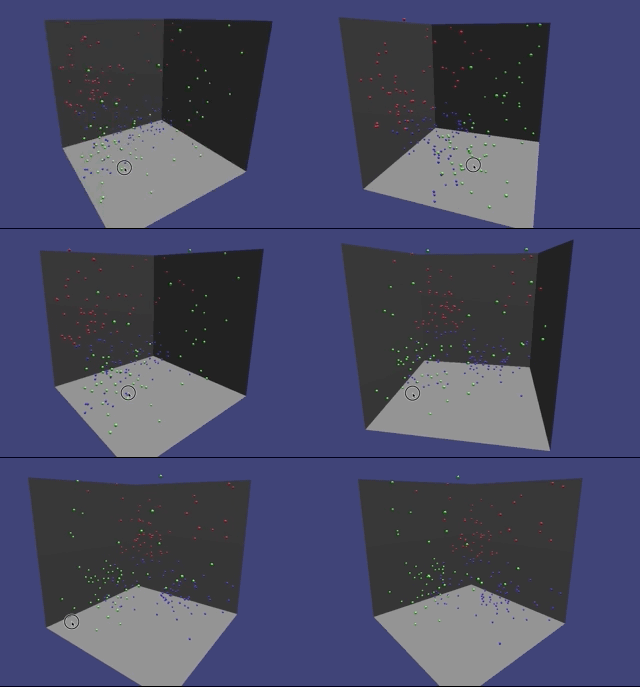
KMeans is an algorithm that finds clusters in groups of data. This can be used to label unclassified data - unsupervised learning. These labels can later be used for supervised learning.
This experiment creates a 3D chart to visualise clusters in a nice way. Use the mouse to rotate the chart.
let chart = new Chart3D()The ThreeJS chart can draw points in 3 dimensions. A single point looks like: [30,5,19]. The chart expects an array of points: [[0,1,0],[1,1,2],[2,3,1]]
First get some fake data
let data = createFakeData()Draw raw data in the chart to see what it looks like
chart.addData(data)You can clear the chart with
chart.clearGraph()let km = new Kmeans()Find 3 clusters using the Kmeans algorithm in the raw data. Draw the clusters by calling addClusters()
km.createClusters(data, 3, (clusters, centroids) => {
    chart.addClusters(clusters)
})This experiment uses native modules.
<script type="module" src="./app.js"></script>Kmeans and the 3DChart can be used by importing into app.js:
import { Chart3D } from "./native_modules/Chart3d.js"
import { Kmeans } from "./native_modules/Kmeans.js"⚠️ Normalise data before displaying / training.- Use Promises instead of callback.
- More than 3 colors in chart
- Chart legend
