"Standard metrics and dashboards for Gateway API resources"
Kube State Metrics CustomResourceState configurations for Gateway API resources.
The contents of this repository are intended to be used with kube-state-metrics. To use the CustomResourceState, see the configuration information for how to configure an existing or separate kube-state-metrics instance with a custom resource configuration.
The CustomResourceState is available at ./config/default/custom-resource-state.yaml
For easier consumption via kustomize, a ./kustomization.yaml
is available that generates a ConfigMap named custom-resource-state with the
CustomResourceState data in a key called custom-resource-state.yaml.
An example of how to use this with kube-promethues in shown in ./config/examples/kube-prometheus The kustomization config does the following:
- mounts the ConfigMap as a volume in the kube-state-metrics Deployment
- adds the
--custom-resource-state-config-filearg to the container, referencing the file in the ConfigMap - patches the
kube-state-metricsClusterRole with permissions forcustomresourcedefinitionsand the various Gateway API resources in thegateway.networking.k8s.ioapiGroup - changes the kube-state-metrics image to a version that supports CustomResourceState and has various issues fixed.
- includes example Grafana dashboards
- includes example Prometheus Alert rules
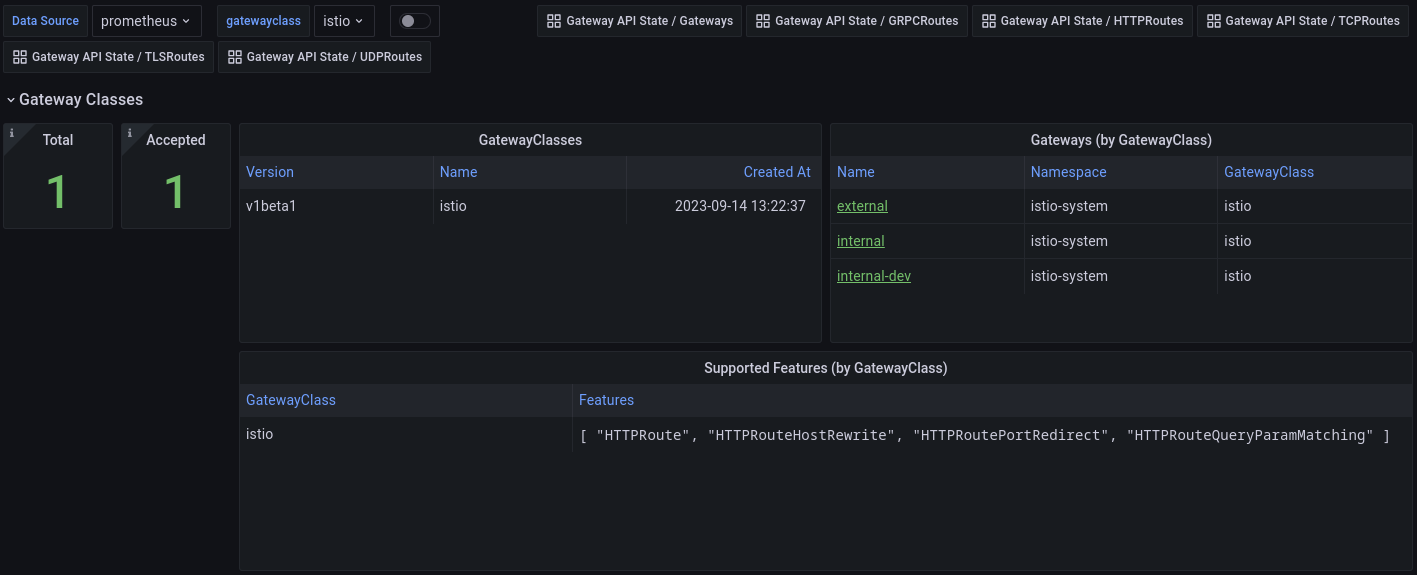
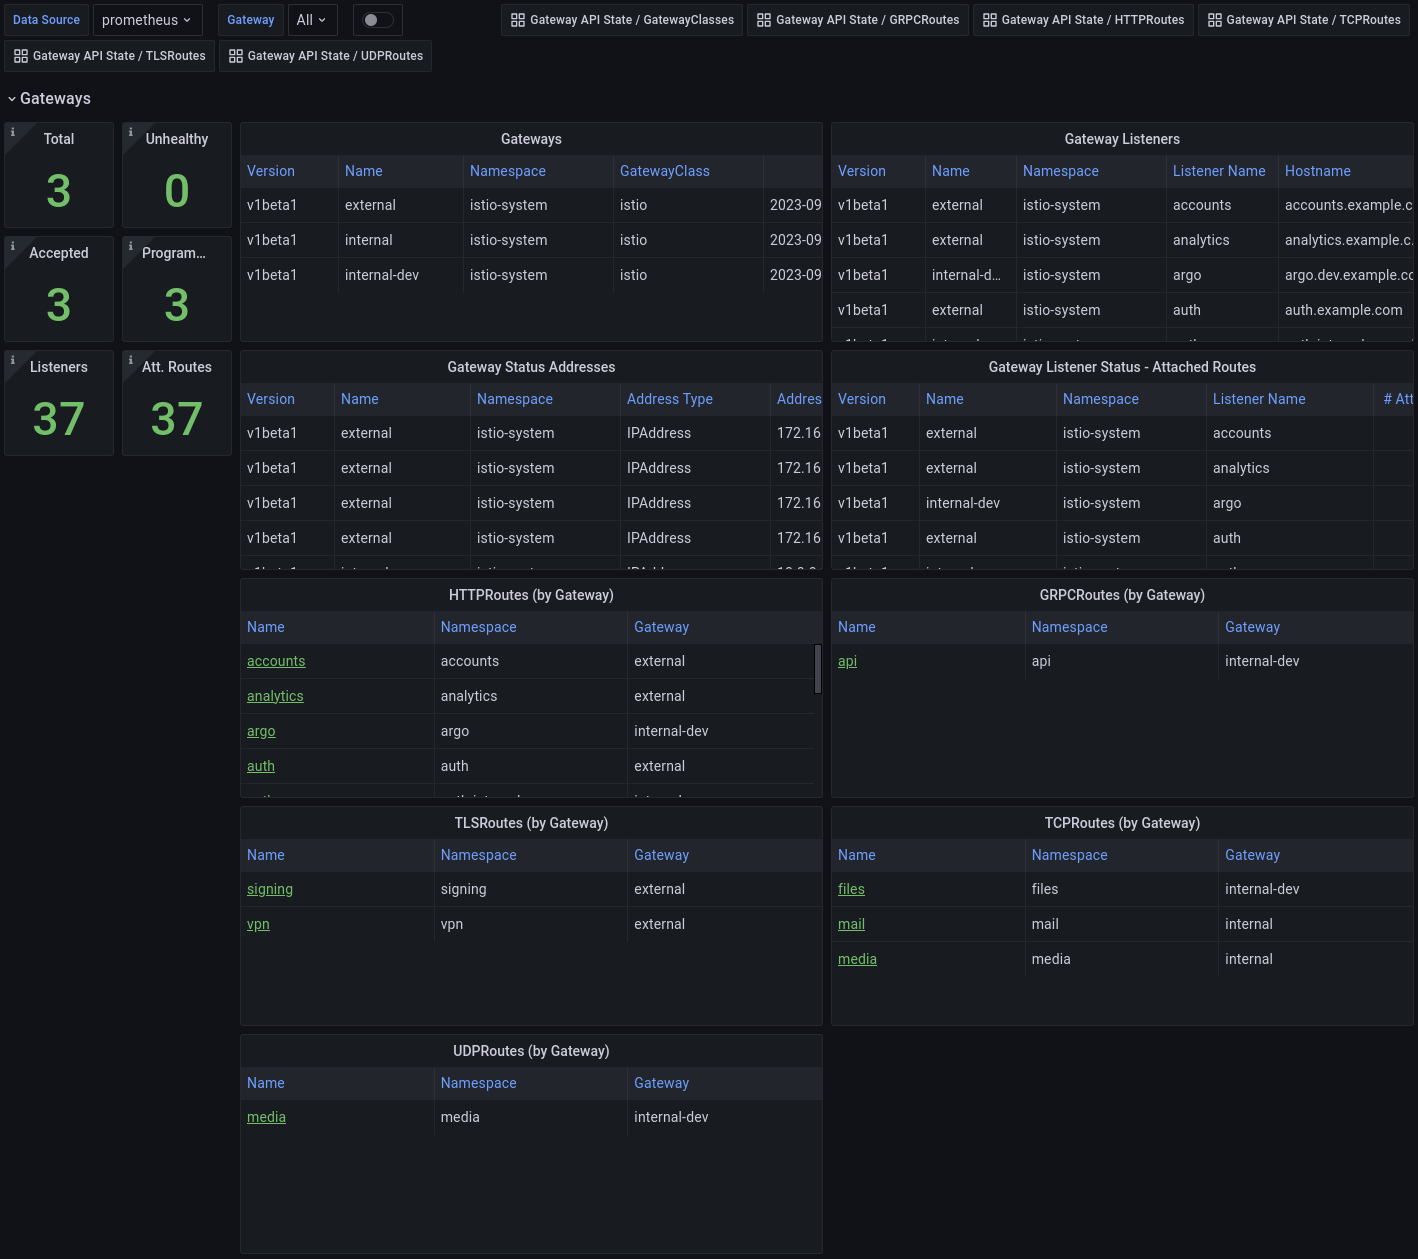
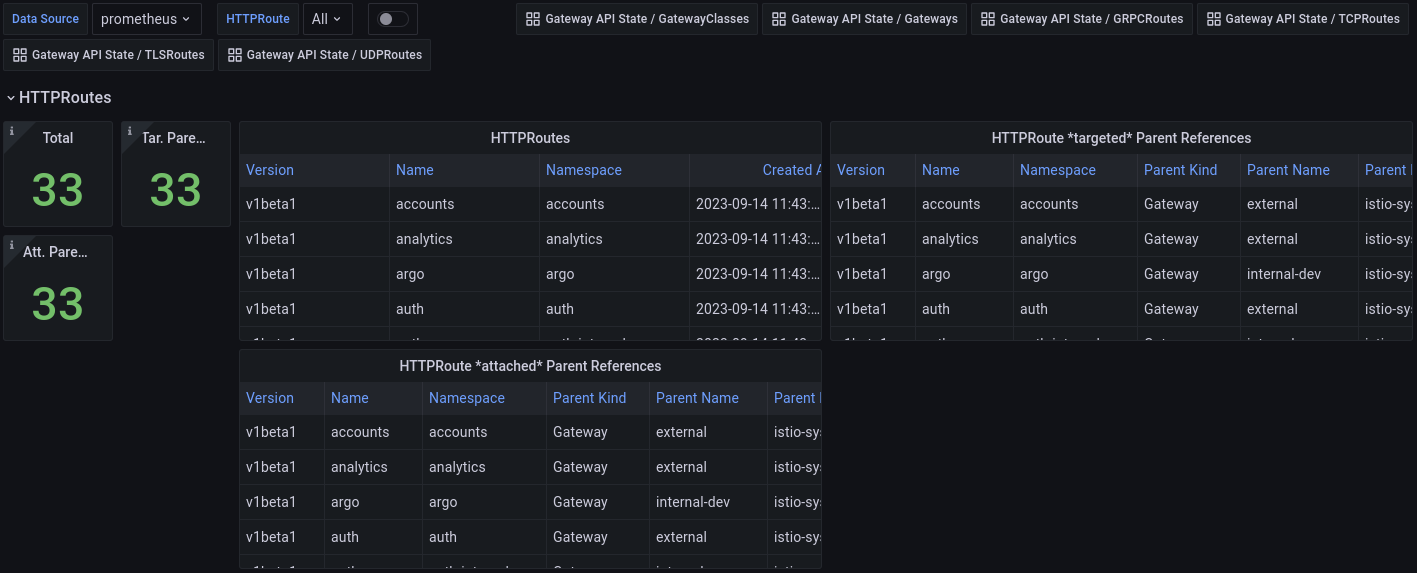
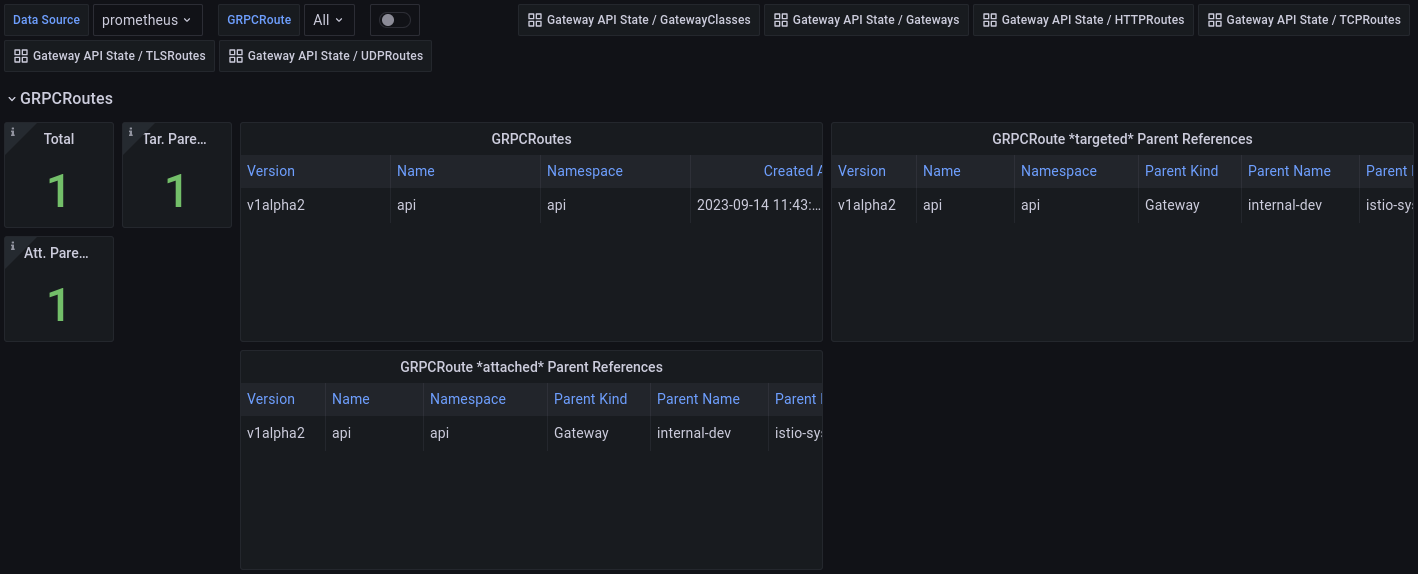
A set of Grafana dashboards are available in ./config/examples/dashboards and on grafana.com You can import them directly into Grafana and modify as needed. The dashboards are divided by resources (GatewayClasses, Gateways, HTTPRoutes, GRPCRoutes, TLSRoutes, TCPRoutes and UDPRoutes), with variables for filtering, and links to drill down from a GatewayClass to a Gateway to all the routes.
https://grafana.com/grafana/dashboards/19432
https://grafana.com/grafana/dashboards/19433
https://grafana.com/grafana/dashboards/19434
https://grafana.com/grafana/dashboards/19570
https://grafana.com/grafana/dashboards/19572
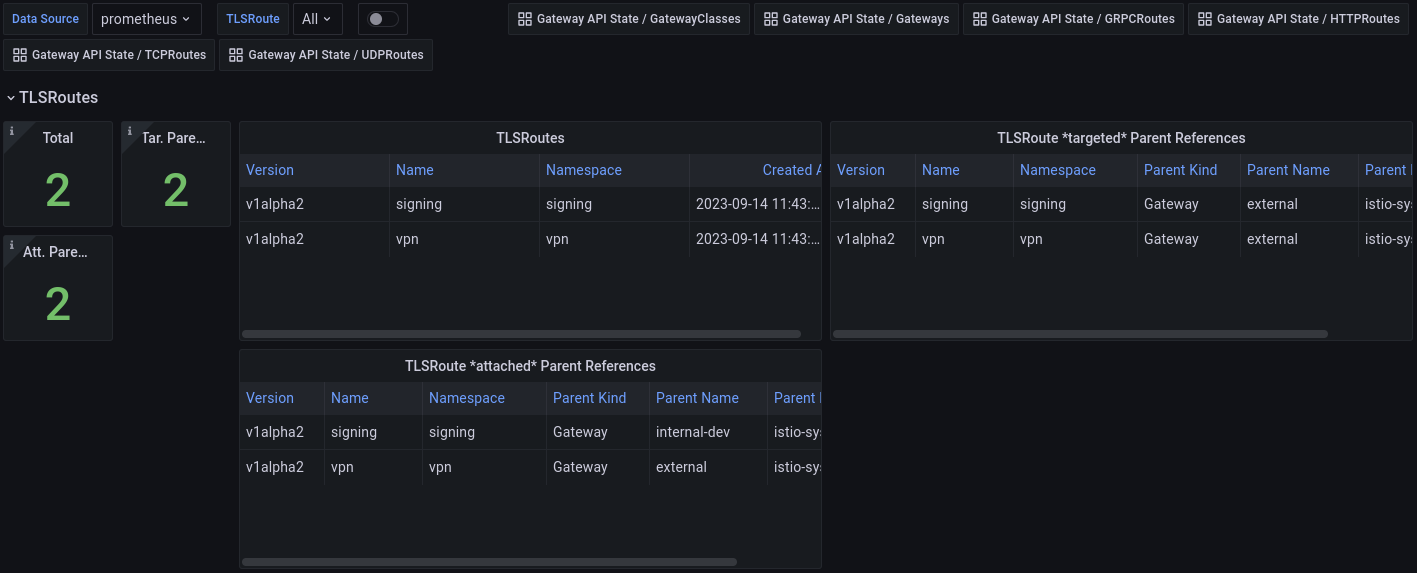
https://grafana.com/grafana/dashboards/19571
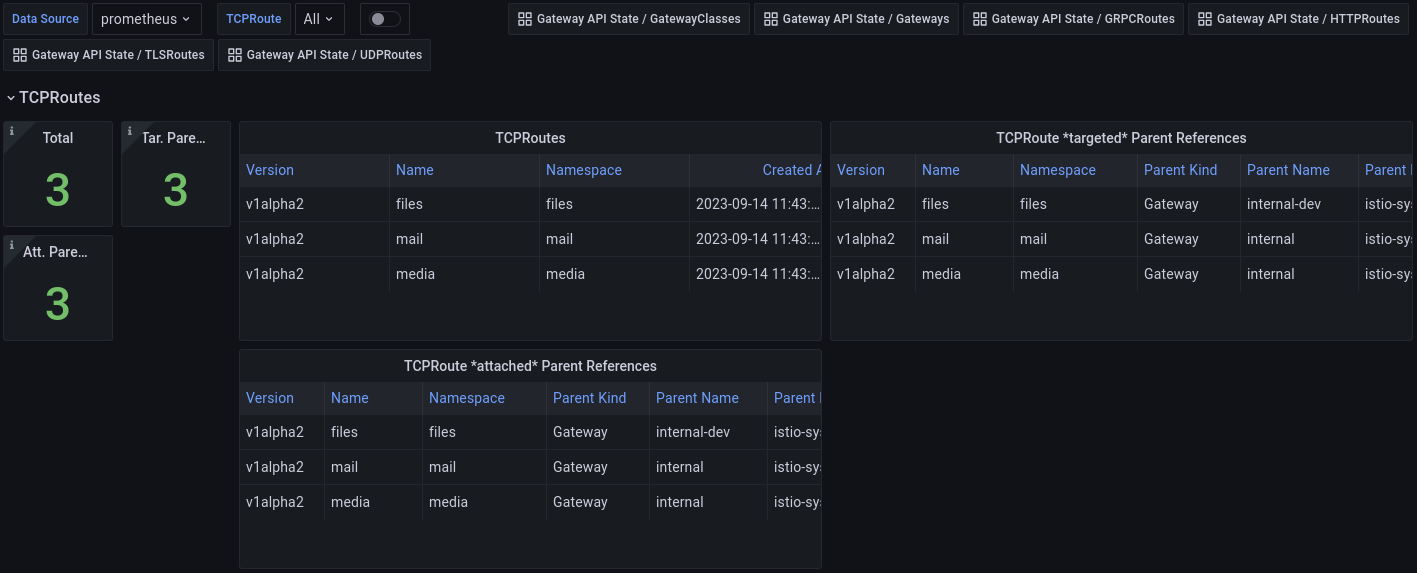
https://grafana.com/grafana/dashboards/19573
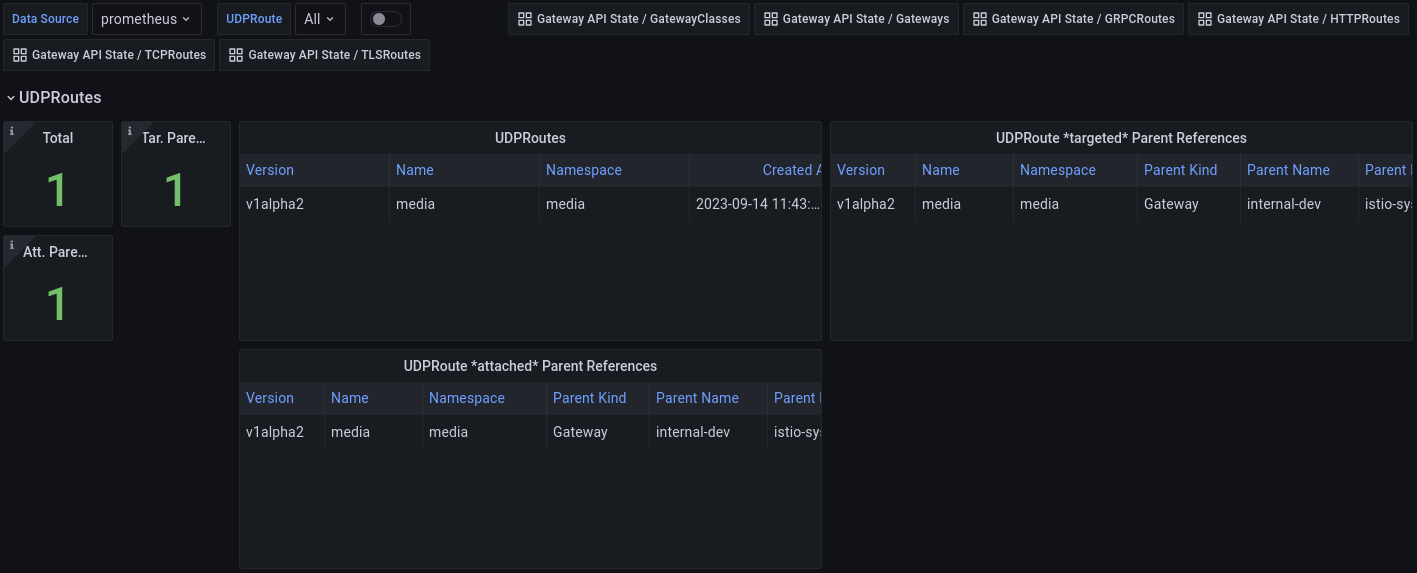
A set of example Alerts are available in ./config/examples/rules. You can create the PrometheusRule resource directly or modify it as needed.
All metrics have GVK labels to allow more specific matching and filtering. For example:
{
  customresource_group="gateway.networking.k8s.io"
  customresource_kind="Gateway",
  customresource_version="v1beta1"
}
In addition, all metrics have a name and namespace label, where applicable:
{
  namespace="<NAMESPACE>",
  name="<NAME>"
}
All metrics are prefixed with gatewayapi_.
For example, gatewayapi_gateway_status.
The full list of metrics is available at ./METRICS.md
Dashboards are written in jsonnet, and use the grafonnet library.
Resulting dashboard json files are checked in.
To generate dashboards, run make generate-dashboards.
Local development can be done using a combination of automatic jsonnet execution and using the grafana-operator to automatically update dashboards in Grafana. This allows for a relatviely fast development loop where you can change a dashboard jsonnet file, save it, then see the changes automically in a browser.
To set up the local development environment, run the following:
./hack/local_dev.shGrafonnet is a powerful tool, but it may not cover all scenarios in its documentation. If you encounter issues or roadblocks, don’t be afraid to experiment with different approaches. Learning through trial and error can often lead to better understanding and innovative solutions. Remember, every challenge is an opportunity to learn.
Grafana’s user interface can be an invaluable reference when working with transformations and overrides in Grafonnet. If you’re unsure about how to implement a specific feature in Grafonnet, try creating it in the Grafana UI first. Then, export the dashboard as JSON. This exported JSON can serve as a reference for how to implement the same feature in Grafonnet.
Consider creating abstract representations of panels that are used repeatedly across your dashboards. This not only helps avoid repetition but also ensures consistency in the layout and design of your panels.
Abstraction can also make your code more readable and maintainable, especially when dealing with complex input patterns. When deciding whether to create a new abstraction or reuse an existing one, keep the “Don’t Repeat Yourself” (DRY) principle in mind. If you find yourself writing similar code for multiple panels, it might be time to consider abstraction.
By following these guidelines, you can navigate Grafonnet development more effectively and efficiently. Remember, the goal is not just to create functional dashboards, but also to write clean, maintainable code that can be understood and modified by others.
Contributions are welcome in the form of bugs, feature requests & pull requests. Before submitting a new issue, please use the search function to see if there is already a similar report or pull request. Roadmap items will be represented as Issues.