kubenurse is a little service that monitors all network connections in a kubernetes cluster and exports the taken metrics as prometheus endpoint.
You can get the Docker Image from Docker Hub. The examples directory contains yamls that deploy the kubenurse to the kube-system namespace.
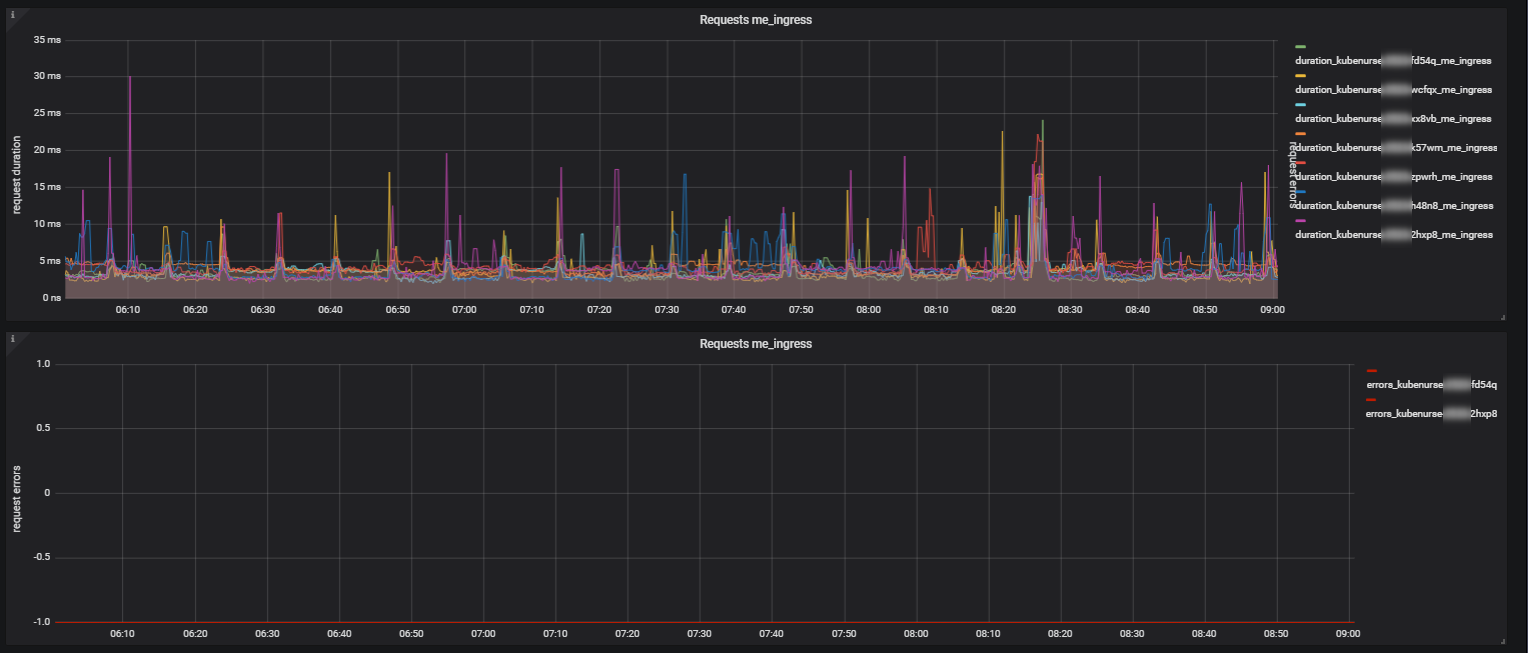
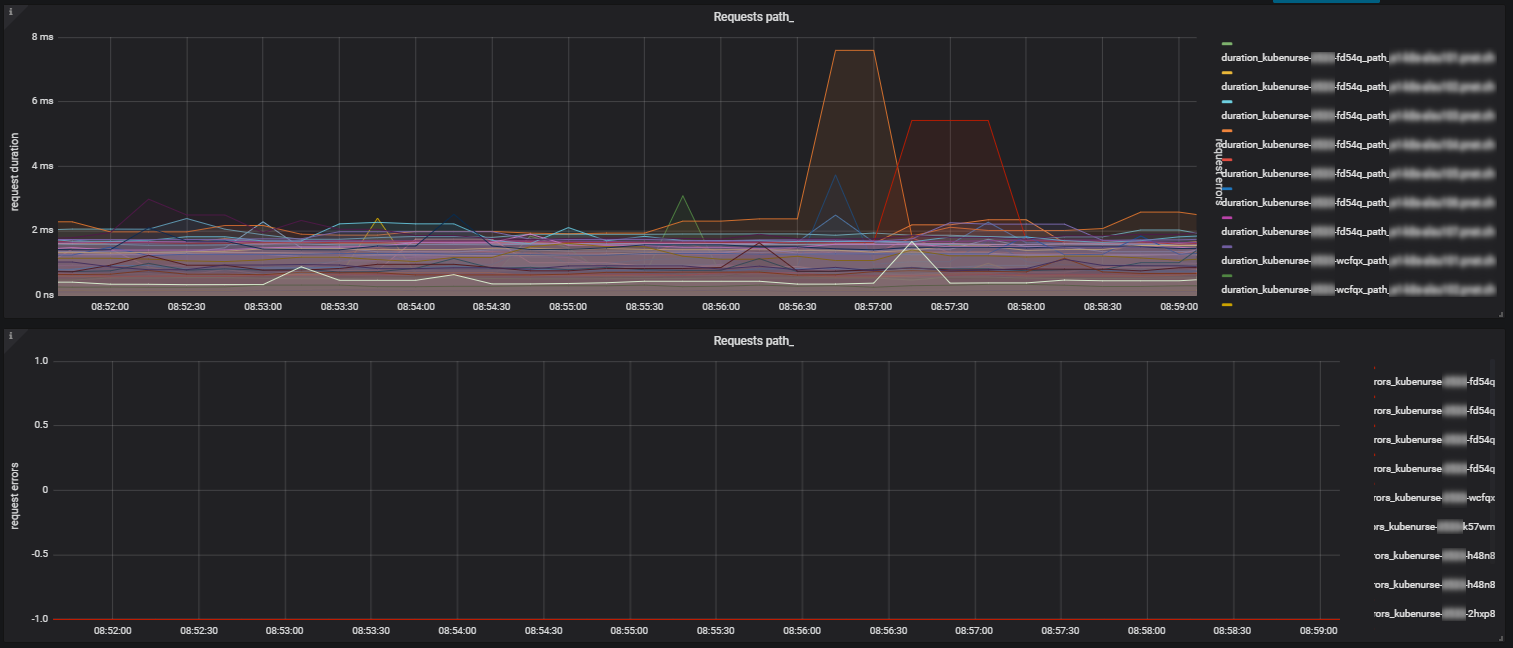
After everything is set up and Prometheus scrapes the kubenurses, you can build dashboards that show network latencies and errors or use the metrics for alarming.
kubenurse is configured with environment variables:
KUBENURSE_INGRESS_URL: An URL to the kubenurse in order to check the ingressKUBENURSE_SERVICE_URL: An URL to the kubenurse in order to check the kubernetes serviceKUBENURSE_INSECURE: If "true", TLS connections will not validate the certificateKUBENURSE_EXTRA_CA: Additional CA cert path for TLS connectionsKUBENURSE_NAMESPACE: Namespace in which to look for the neighbour kubenursesKUBENURSE_NEIGHBOUR_FILTER: A label selector to filter neighbour kubenurses
Following variables are injected to the Pod by Kubernetes and should not be defined manually:
KUBERNETES_SERVICE_HOST: Host to communicate to the kube-apiserverKUBERNETES_SERVICE_PORT: Port to communicate to the kube-apiserver
The used http client appends the certificate /var/run/secrets/kubernetes.io/serviceaccount/ca.crt if found.
The kubenurse listens http on port 8080 and exposes endpoints:
/: Redirects to/alive/alive: Returns a pretty printed JSON with the check results, described below/alwayshappy: Returns http-200 which is used for testing itself/metrics: Exposes prometheus metrics
The /alive endpoint retuns a JSON like this with status code 200 if everything is alright else 500:
{
  "api_server_direct": "ok",
  "api_server_dns": "ok",
  "me_ingress": "ok",
  "me_service": "ok",
  "hostname": "kubenurse-1234-x2bwx",
  "neighbourhood_state": "ok",
  "neighbourhood": [
   {
    "PodName": "kubenurse-1234-8fh2x",
    "PodIP": "10.10.10.67",
    "HostIP": "10.12.12.66",
    "NodeName": "k8s-66.example.com",
    "Phase": "Running"
   },
   {
    "PodName": "kubenurse-1234-ffjbs",
    "PodIP": "10.10.10.138",
    "HostIP": "10.12.12.89",
    "NodeName": "k8s-89.example.com",
    "Phase": "Running"
   }
  ],
  "headers": {
   "Accept": [
    "text/html,application/xhtml+xml,application/xml;q=0.9,image/webp,image/apng,*/*;q=0.8"
   ],
   "Accept-Encoding": [
    "gzip, deflate, br"
   ],
   ...
  }
}Every five seconds and on every access of /alive, the checks described below are run.
Check results are cached for 3 seconds in order to prevent excessive network traffic.
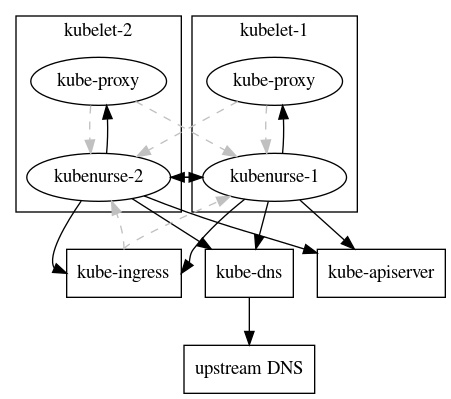
A little illustration of what communication occures, is here:
Checks the /version endpoint of the Kubernetes API Server through
the direct link (KUBERNETES_SERVICE_HOST, KUBERNETES_SERVICE_PORT).
Metric type: api_server_direct
Checks the /version endpoint of the Kubernetes API Server through
the Cluster DNS URL https://kubernetes.default.svc:$KUBERNETES_SERVICE_PORT.
This also verifies a working kube-dns deployment.
Metric type: api_server_dns
Checks if the kubenurse is reachable at the /alwayshappy endpoint behind the ingress.
This address is provided by the environment variable KUBENURSE_INGRESS_URL that
could look like https://kubenurse.example.com.
This also verifies a correct upstream DNS resolution.
Metric type: me_ingress
Checks if the kubenurse is reachable at the /alwayshappy endpoint through the kubernetes service.
The address is provided by the environment variable KUBENURSE_SERVICE_URL that
could look like http://kubenurse.mynamespace.default.svc:8080.
This also verifies a working kube-proxy setup.
Metric type: me_service
Checks if every neighbour kubenurse is reachable at the /alwayshappy endpoint.
Neighbours are discovered by querying the kube-apiserver for every Pod in the
KUBENURSE_NAMESPACE with label KUBENURSE_NEIGHBOUR_FILTER.
The request is done directly to the Pod-IP and the metric types contains the prefix
path_ and the hostname of the kubelet on which the neighbour kubenurse should run.
Metric type: path_$KUBELET_HOSTNAME
All checks create exposed metrics, that can be used to monitor:
- SDN network latencies and errors
- kubelet-to-kubelet network latencies and errors
- pod-to-apiserver communication
- Ingress roundtrip latencies and errors
- Service roundtrip latencies and errors (kube-proxy)
- Major kube-apiserver issues
- kube-dns (or CoreDNS) errors
- External DNS resolution errors (ingress URL resolution)
At /metrics you will find these:
kubenurse_errors_total: Kubenurse error counter partitioned by error typekubenurse_request_duration: Kubenurse request duration partitioned by error type, summary over one minute


