Bash, Python and ROOT scripts for the process of digital waveforms taken with a CAEN digitizer and its WaveDump readout program.
CERN ROOT is needed to run scripts ended with .C. Shell scripts can be run in a Linux or Mac terminal. They can also be run in MobaXterm in a Windows PC.
CAEN WaveDump is not needed to run the scripts here, but its output is the input for these scripts.
- download the package from https://github.com/jintonic/toward.git
- get into folder run in your local copy, create a directory there with its name to be an integer run number, for example, 153
- get into the just created subdirectory and create a WaveDump configuration file there named daq.cfg (one can take run/0/daq.cfg as an example)
- run
wavedump daq.cfgthere to create binary output file wave?.dat, where ? is the channel number - get back to the base directory, run
./w2r.sh <run number> <channel number>to convert wave?.dat to wave?.root - use other scripts to process the generated root file
- w2r.C: a ROOT script to convert a CAEN WaveDump binary output to ROOT format, align baselines of waveforms to zero, and save basic parameters of waveforms
- w2r.sh: a shell script to fetch information from a WaveDump configuration file and pass it to w2r.C
- q2i.C: a ROOT script to get heights of charge pulses using trapezoidal filter and convert charge pulses to current ones using numerical differentiation
- i2q.C: a ROOT script to convert current pulses to charge ones
- integrate.C: a ROOT script to integrate waveforms in a certain range and save the result to the original data tree
- show.py: a Python script to show waveforms in a ROOT file.
- Works with WaveDump without any modification of code on both sides
- All scripts can be run directly in Linux, Mac and Windows without compilation and installation
- Data are saved as basic types in ROOT TTree ntuples, which can be easily open without loading extra libraries defining complicated data structure. Uproot can be used to load the data for analysis in Python
- Super short variable names for quick analysis using ROOT TTree::Draw function in a ROOT interactive session. For example,
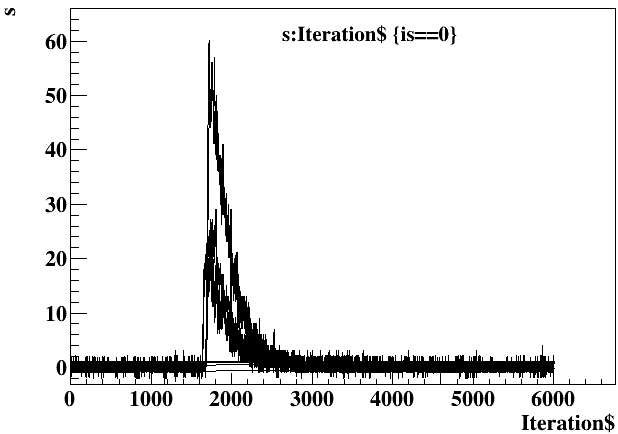
[root] t->Draw("s:Iteration$","is==0","l",5,2)shows 5 non-saturated (is==0) waveforms (s: individual waveform samples, Iterations$: sample index) starting from event 2:


