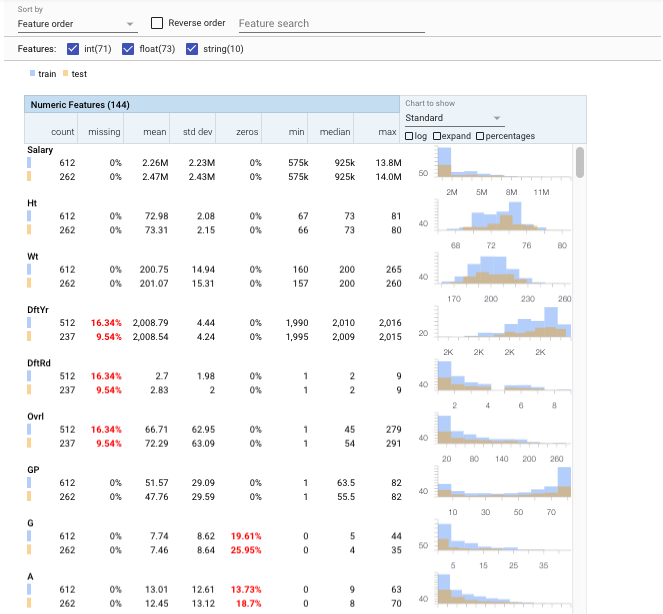
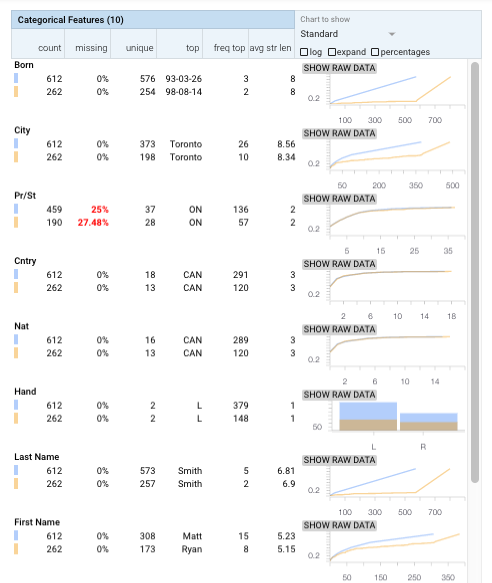
Facets allows for easy visualization. For using Facets, first clone the git repository:
git clone https://github.com/PAIR-code/facets.git
To use the visualization capabilities, you will have to add an nbextension. Therefore, find the path to the facets-dist directory in the cloned git repo and execute the following line of code:
jupyter nbextension install facets-dist/ --user
In which case 'facets-dist' is the path to the respective folder.
If the above command still does not show the visualizations on the notebook, copy the file called facets-jupyter.html in 'facets/facets-dist' folder your local anaoconda file path '[anaconda_path]/share/jupyter/nbextensions/'. This is a known issue PAIR-code/facets#41
You might need to restart jupyter after this and proceed with the vizualisation. For a more detailed installation guide and updates, have a look at:
Do also install the protobuf package
conda install protobuf
# Add the facets overview python code to the python path
import sys
# FACETS_PATH is the full path to the python file in the clonde github repo of Facets.
# It should look similar to this: ".../facets/facets_overview/python"
# If you have cloned the facets repo to your current working directory, you can proceed.
# If you have chosen another location, just add it here.

FACETS_PATH = 'facets-master/facets_overview/python'
sys.path.append(FACETS_PATH)
import pandas as pd
train_data = pd.read_csv(
"train.csv",
#sep=r'\s*,\s*',
engine='python',
na_values="?")
test_data = pd.read_csv(
"test.csv",
#sep=r'\s*,\s*',
engine='python',
na_values="?")
test_salaries = pd.read_csv(
"test_salaries.csv",
#sep=r'\s*,\s*',
engine='python',
na_values="?")
test_data = pd.concat([test_salaries, test_data], axis=1)# Calculate the feature statistics proto from the datasets and stringify it for use in
# facets overview
from generic_feature_statistics_generator import GenericFeatureStatisticsGenerator
import base64
gfsg = GenericFeatureStatisticsGenerator()
proto = gfsg.ProtoFromDataFrames([{'name': 'train', 'table': train_data},
{'name': 'test', 'table': test_data}])
protostr = base64.b64encode(proto.SerializeToString()).decode("utf-8")# Display the facets overview visualization for this data
from IPython.core.display import display, HTML
HTML_TEMPLATE = """<link rel="import" href="/nbextensions/facets-dist/facets-jupyter.html" >
<facets-overview id="elem"></facets-overview>
<script>
document.querySelector("#elem").protoInput = "{protostr}";
</script>"""
html = HTML_TEMPLATE.format(protostr=protostr)
display(HTML(html))Facets Overview provides a quick understanding of the distribution of values across the features of their datasets. Multiple datasets, such as a training set and a test set, can also be compared on the same visualization.
Common data issues that can hamper machine learning are pushed to the forefront, such as: unexpected feature values, features with high percentages of missing values, features with unbalanced distributions, and feature distribution skew between datasets.
The Facets visualizations currently work only in Chrome browsers

