This project visualizes the UK at district, unitary, or country levels using UK shapefiles from opendatasoft and UK measurements from nomisr API. Extract and manipulate the data and plot UK maps using Python geopandas.
For pipeline replication, as an example, only Python installation is needed. All extracted data are available in the cloud storage directory
-
Clone the Repository: Clone the project repository to your local machine using Git:
git clone https://github.com/KyriakosJiannis/nomis-visualisation
-
Navigate to the Project Directory: Move to the project directory:
cd nomis-visualisation -
Activate your virtual environment (recommended):
python -m venv venv
source venv/bin/activate  # On Windows, use: venv\Scripts\activate
-
Install the required packages:
pip install -r requirements.txt
-
Run the Python pipeline script:
python ./pipelne/pipeline.py
root/
├── config/
│   └── config.ini
├── input/
│   └── data.txt
├── notebooks/
│   └── nomis_analysis.ipynb
├── output/
│   │   ├── religions_plot_bar1.png
│   │   └── religions_plot_bar2.png
├── pipeline/
│   ├── __init__.py
│   └── run_pipeline.py
├── src/
│   ├── __init__.py
│   ├── analysis/
│   │   ├── __init__.py
│   │   └── analysis_module.py
│   ├── R_scripts/
│   │   └── get_data_nomis.R
├── utils/
│   └── __init__.py
├── .gitignore
├── LICENSE
├── README.md
└── requirements.txt
Provide examples and instructions on how to use the plot_nomis_data function.
Include code snippets and explanations for different scenarios with more details in nomis_analysis.ipynb.
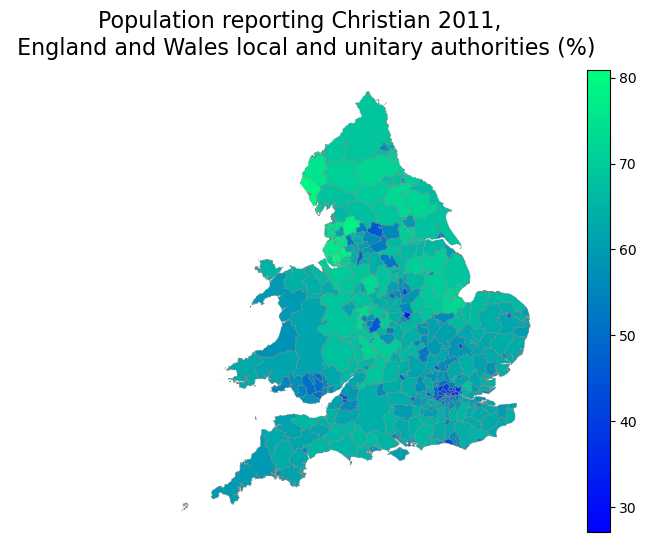
Example 1: Religion Census UK
plot_nomis_data(
            geo_data=subset_df,
            cmap="winter",
            title="Population reporting Christian 2011, \n England and Wales local and unitary authorities (%)"
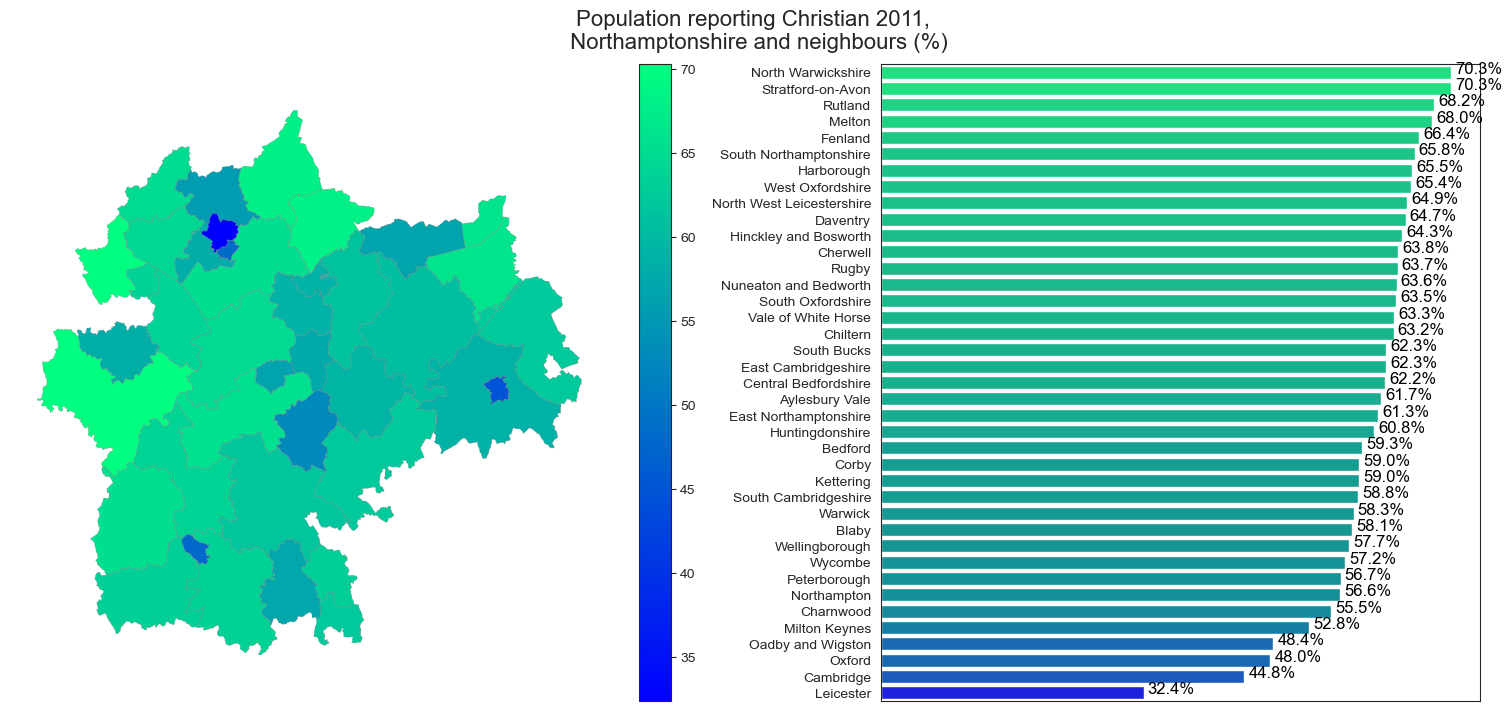
)Example 2: Sub-selection of Selected Counties
# Sub-selection of selected counties; this example uses Northamptonshire and its neighbors' area
counties = ['Northamptonshire', 'Central Bedfordshire', 'Milton Keynes', 'Bedford', 'Leicestershire', 'Leicester','Rutland', 'Peterborough', 'Cambridgeshire', 'Oxfordshire', 'Buckinghamshire', 'Warwickshire']

plot_nomis_data(
            geo_data=subset_df[subset_df['county'].isin(counties)],
            cmap="winter",
            title="Population reporting Christian 2011, \n Northamptonshire and neighbours (%)",
            barchart="On"
)The next step is to create a web app for religion. Utilise opendatasoft API or/and R (nomisR) and Python pipelines for more versatile and comprehensive extractions beyond religions, and perform analysis using both programming languages.
This project is licensed under the MIT License.

