This package provides a function to set a custom ggplot2 theme and adds the Barlow font.
Much of the code stems from Long Nguyen with whom I worked on a collaborative project for CorrelAid e.V..
You can install the development version from GitHub with:
# install.packages("devtools")
devtools::install_github("L-Groeninger/plotutils")This is a basic example which first shows you how plots look without the custom theme:
library(ggplot2)

example_plot <- ggplot(mtcars, aes(x = mpg, y = disp,
                                   colour = as.factor(cyl))) +
  geom_point() +
  labs(title = "Relationship between Miles per Gallon and Displacement",
       x = "Miles per Gallon",
       y = "Displacement",
       colour = "Cylinders")

example_plot
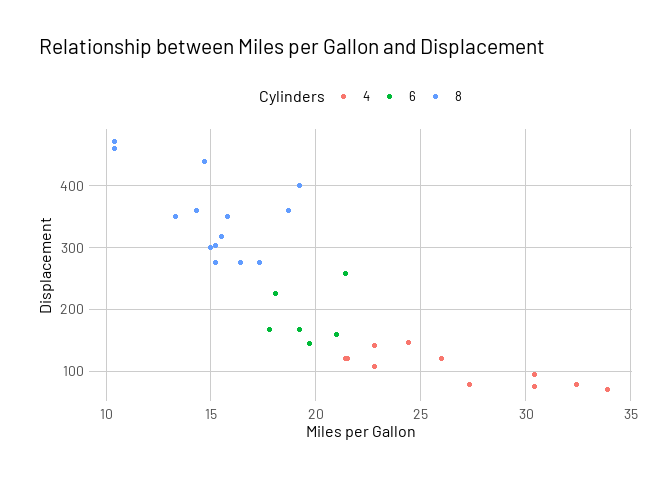
Now we can set the custom theme for our plots to have our desired font and a cleaner look. Additionally the position of the legend is moved up.
# Set the custom theme globally.
plotutils::set_custom_theme(base_size = 12)

example_plotPlease note that the plotutils project is released with a Contributor Code of Conduct. By contributing to this project, you agree to abide by its terms.

