Out of the box, keycloak does not expose any metrics about what it is doing.
It does however allow you to write code that is listening to all kinds of keycloak-internal events.
This project counts those events and allows you to expose them to prometheus with the prometheus-filesystem-exporter.
This project will help you expose two metrics:
keycloak_events_totalwith labels- realm="String",
- type="
org.keycloak.events.EventType", - client_id="String",
- ip_address="String"
keycloak_admin_events_totalwith labels- realm="String"
- operation="
org.keycloak.events.admin.OperationType" - resource="
org.keycloak.events.admin.ResourceType", - client_id="String",
- ip_address="String"
The magic lies in the labels. The labels basically expose the underlying keycloak event details and allow for detailed filtering. The unique metric + label combination's value will be increased by one whenever an event of this type is emmited in keycloak.
The code in this project compiles into an SPI that needs to be installed to your keycloak instance.
The simplest way is to download the latest JAR from jitpack.io and put it into your keycloak installation directory/providers.
Detailled instructions on SPI installation can be found in the keycloak docs.
Also make sure to check out the Dockerfile.
The SPI requires you to provide a configuration option describing where to write the event counter files.
SPI configuration happens in keycloaks standalone.xml.
Within <subsystem xmlns="urn:jboss:domain:keycloak-server:1.1"></subsystem> you need to add the following lines:
<spi name="eventsListener">
    <provider name="com.larscheidschmitzhermes:keycloak-monitoring-prometheus" enabled="true">
        <properties>
            <property name="eventsDirectory" value="/metrics"/>
         </properties>
    </provider>
</spi>
For a more advanced example (directory name read from env variable) see the Dockerfile again.
The metrics directory can be specified by setting the KEYCLOAK_PROMETHEUS_EVENTS_DIR environment variable.
This value will only be used if the eventsDirectory configuration value is not set or if it is an empty string.
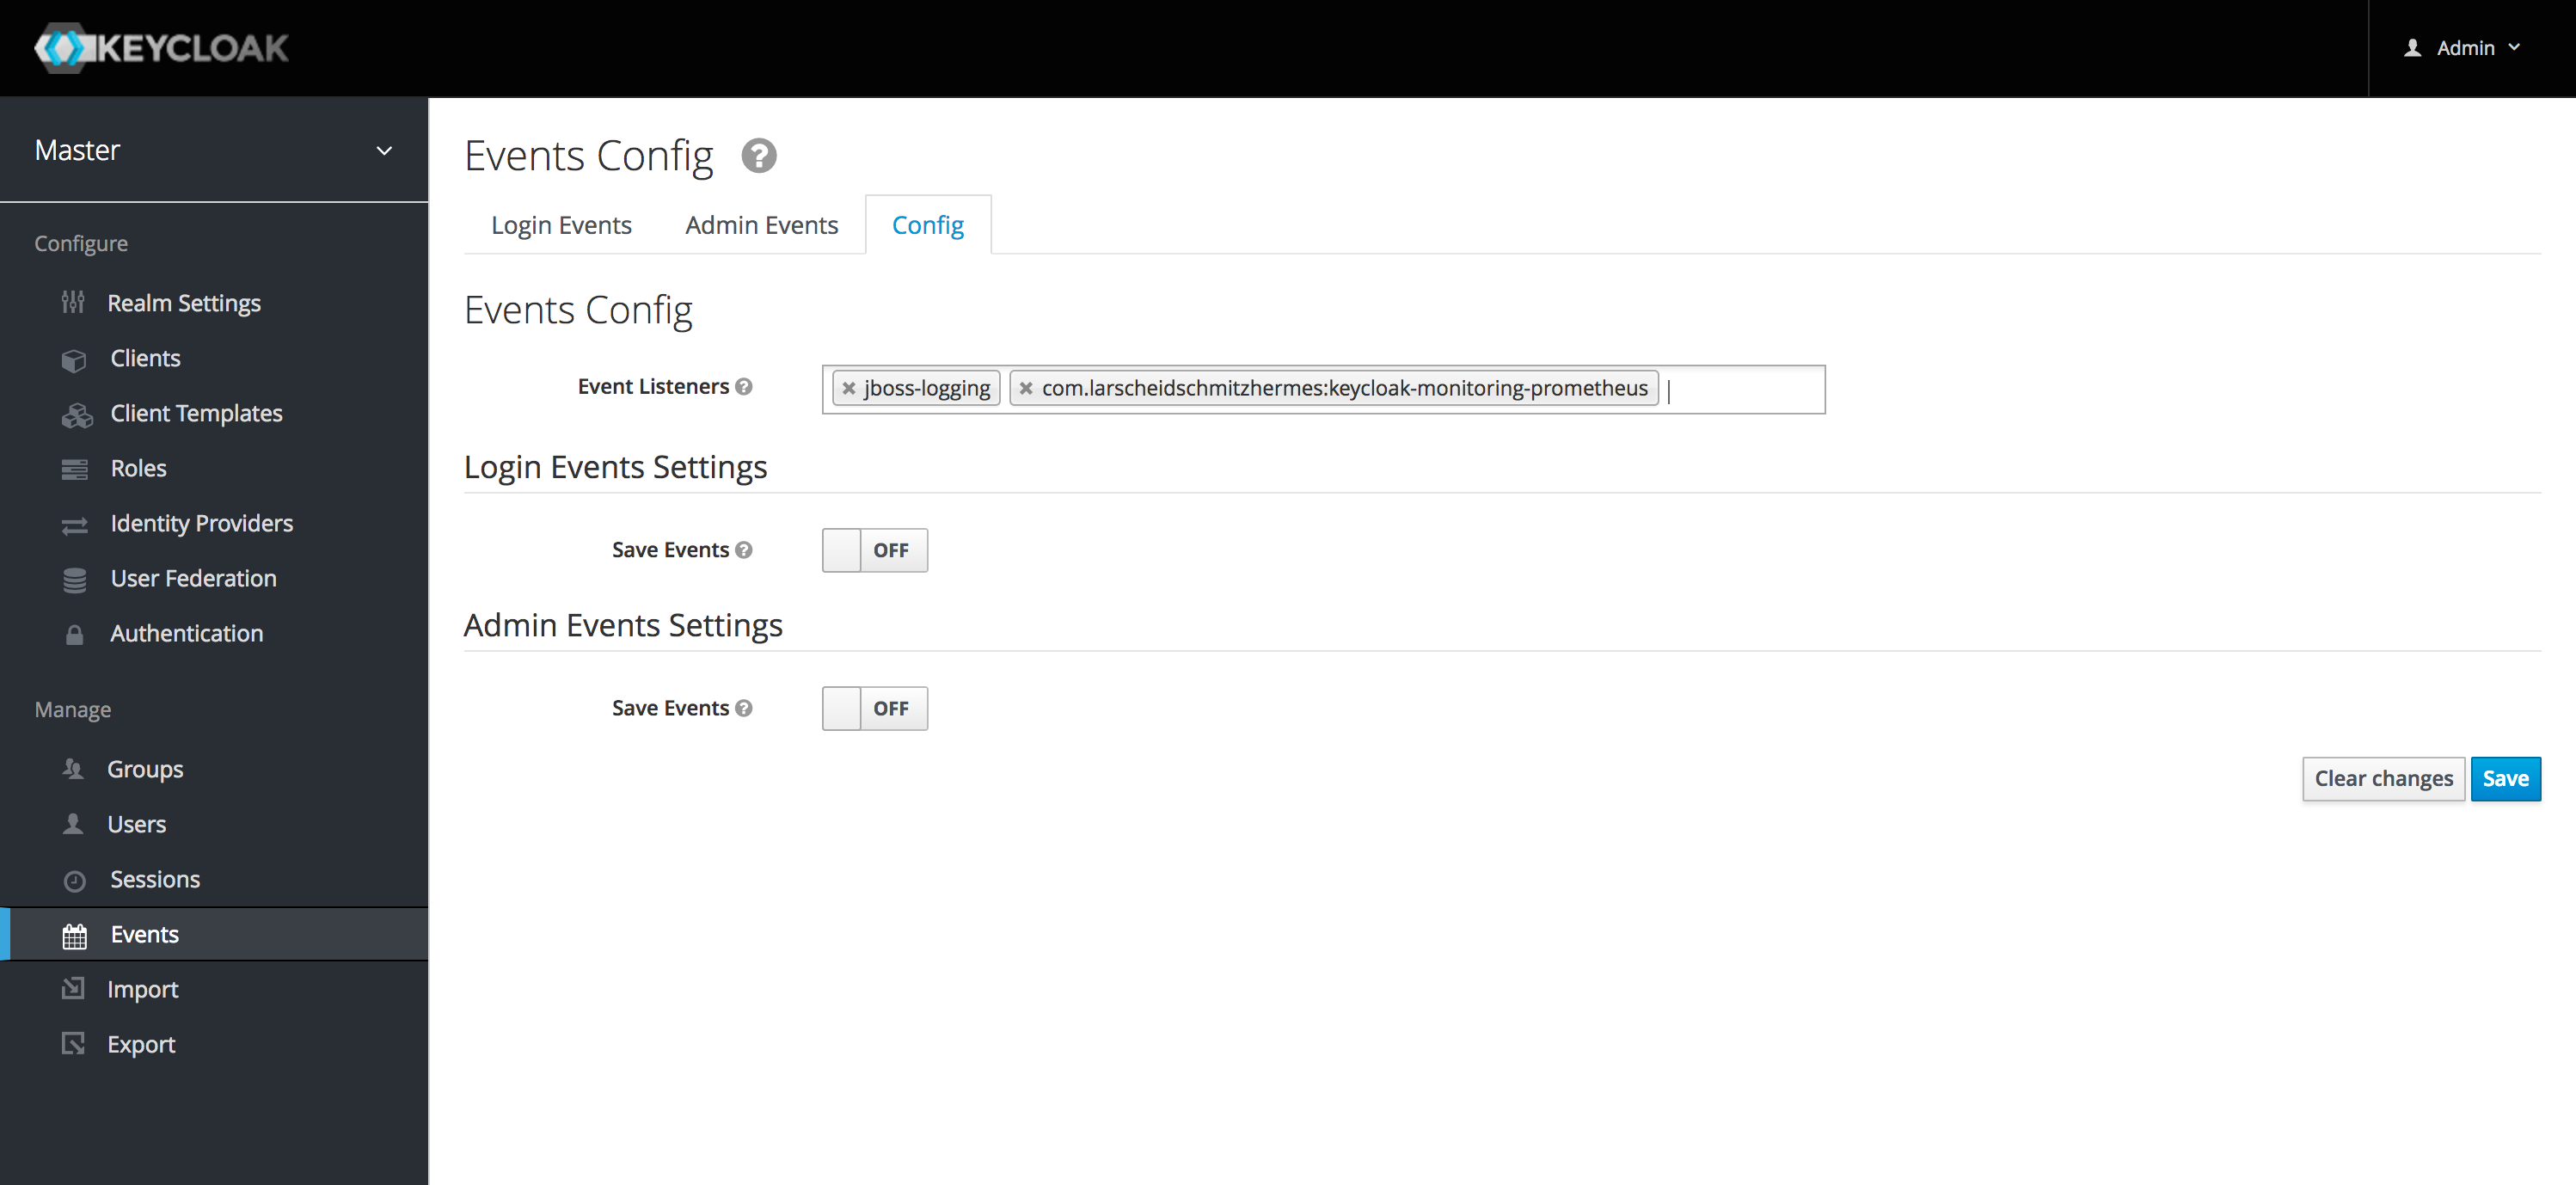
 In keycloak's admin console under
 Events > Config you need to add com.larscheidschmitzhermes:keycloak-monitoring-prometheus as an Event Listener.
Make sure you do this for every realm you want to monitor!
Keycloak supports scripting of configuration changes via CLI. This has the benefit of decoupling configuration changes from the deployed keycloak version allowing easy upgrades of binaries. This is especially beneficial in a containerized environment.
To configure the Prometheus exporter via CLI see Dockerfile.
The content of jboss-cli is added with jboss-cli.sh and embed-server mode. During docker build you will see Keycloak adding the configuration entries to standalone.xml.
For more information refer to Keycloak documentation
Once everything is setup in keycloak, you will start seeing files like keycloak_admin_events_total;realm=master;operation=CREATE;resource=USER in your configured events directory.
These files contain a number stating how often an event with the given parameters was emitted.
The naming scheme is compatible with prometheus-filesystem-exporter,
which you should run next to keycloak to get your events exposed in a prometheus compatible format.